Brand size explains 90% of what people say about brands, but the other 10% is where challengers stand out from established players.
Movability is what lets challengers win: active category battlegrounds where perceptions can outpace brand size.
Priorities reverse with scale, which validates the Ehrenberg-Bass playbook for market leaders: challengers should target high-movability needs, while market leaders should put mainstream needs first.
Growth hides the differentiation that drove it: as a challenger grows, its size starts to explain the same links, so a snapshot study can see a big brand as undifferentiated on the need it grew on.
Mental availability is more than category entry points: memories of product functions, price, place, and promotion come back as fast as CEPs, and many CEPs have low movability, which blocks challengers (40% vs 28% of other needs).
Brand research must take brand size out, otherwise it is only market share in disguise, and it must do so separately for every need: on some, being big lifts a brand’s score a lot; on others, barely at all.
Introduction
Introduction
Differentiation or distinctiveness? What 246 brands say
Should a brand stand for something different from its rivals to be chosen?
It is one of the most fundamental questions in business and marketing, yet it remains unresolved. Despite years of discussion, we still lack solid evidence and data to settle it.
The debate is far from over. At Cannes Lions in June 2026, two of marketing’s best-known professors, Mark Ritson and Byron Sharp, agreed on many things, but reached no agreement on differentiation.
For decades, marketing textbooks have taught that a brand must stand for something different from its rivals to be chosen, an idea that runs from Reeves’s unique selling proposition through Kotler’s Marketing Management to Ries and Trout’s Positioning. Today, that belief is openly contested.
Ritson defends a more nuanced version of the textbook view, which he calls “relative differentiation.” Brands may not be unique, he argues, but they can offer “more of something” than their rivals, and although this kind of advantage is rare, brands should build and protect it. In his words: “My bullshit stat has always been [mental availability is] 70 to 80% of the job. I still maintain that there should be a quotient on top of that which is about differentiation.”1
Sharp concedes that differentiation might matter in some situations, but says the bigger story is “how shockingly low it is or how little it matters.”2 For Sharp, growth comes from distinctiveness, not from a unique position in the market: recognizable colors, fonts, mascots, jingles, and taglines. Communicated widely enough, these assets build the mental availability that turns into buying.
The question divides marketers between two very different growth strategies, and after years of debate, it still rests on claims like “some situations” and “shockingly low.” It deserves evidence and numbers. So we studied 246 brands across five markets, surveying 60,000 respondents, to find out whether being different from your rivals helps a brand grow.
The short answer: Ritson is right. Differentiation matters, and building mental availability around some needs can be 2.5 times easier than around others. For a challenger brand with limited resources, choosing the wrong proposition could be a costly mistake, one it may never recover from.
The longer answer comes down to three principles we uncovered in the data. They determine whether linking a brand to a particular need, whether a buying occasion, a product function, an emotional benefit, or a symbolic one such as status, can put it on a path to growth. They also show why neither pure distinctiveness nor some classic differentiation advice is a reliable route to growth.
Most brands have clear strengths and weaknesses beyond their size
Big brands get linked to almost every need, simply because more people buy them.
Ask American cola buyers whether Coca-Cola tastes great, and 75% say yes. For Virgil’s Cola, it’s 6%. That isn’t a verdict on flavor. Every cola we measured, from Pepsi and RC Cola to Shasta and Zevia, sits where its size predicts.
But only about a third of the needs we measured are this closely size-driven. For the rest, size still matters, but much less. As we’ll see, these are the needs where challengers have a chance to stand out.
Differentiation can look “shockingly low” because, overall, size explains 90% of all brand associations in our study. But that 90% mostly explains why markets change so little: once you are big, being big helps you stay big. It says little about how brands grew into their current positions. The remaining 10%, the mental availability that size cannot explain, is where a brand can move beyond its current position and grow.
If you take size out, across 246 brands, most brands in every category have clear, distinct strengths and weaknesses. Three in four have both at the same time.
Behavio (2026)
Figure 1
Three properties of each need shape a brand’s chance to break through
We measured 775 needs across all 4Ps: buying occasions, product functions, emotional benefits, and symbolic ones such as status or country of origin, as well as price, place, and promotion. Then we examined how often brands manage to break through on each. The differences are striking.
Every need has three characteristics that shift a brand’s chance of breaking through on it, and their weight depends on brand size.
Behavio (2026)
Figure 2
Occupancy and prevalence are intuitive concepts, and neither is new to marketers. What we add is how much each matters for brands of different sizes.
Movability is less intuitive, but for challengers it matters more than occupancy and prevalence. They break through almost only on needs where the fight is still open. Where the fight is settled and size predicts everything, they almost never do.
Movable needs are where brand size matters less, and competitors actively win or lose ground. Take natural food in US dog food. One challenger scores 13 points above what its size would predict, while the market leader scores 16 points below. In other words, a brand bought by far fewer people is associated with natural food just as often as the market leader. Other brands are winning and losing ground on the same need.
Size decides great taste in colas, not natural food in dog food
Behavio (2026)
Figure 3
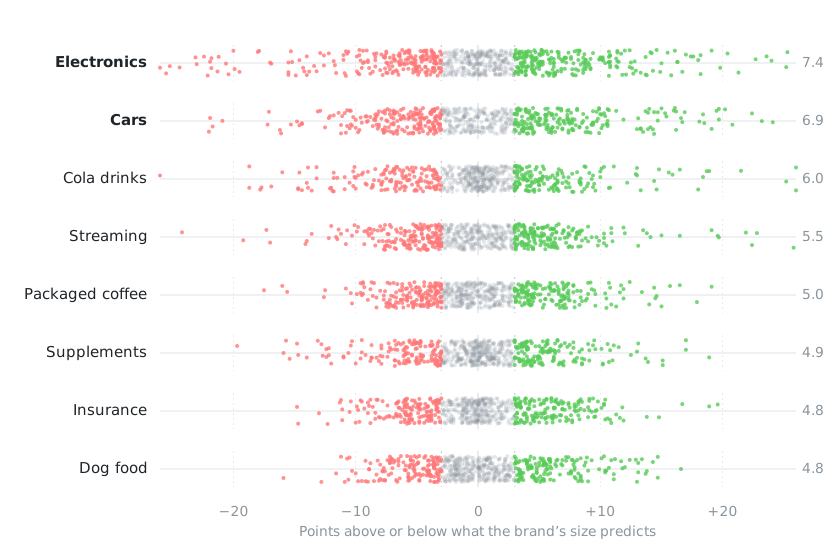
About half of all needs have medium movability, meaning competitors score, on average, 3 to under 6 points away from what their size predicts. Another 14% are highly movable, with competitors at least 6 points away, and some brands as much as 25 points above or below their predicted scores. Examples include environmentally friendly cars, installation services and expert advice in electronics, sports on streaming services, natural ingredients in cola, sensitive digestion in dog food, and immune support in supplements. Many of these are product functions.
Needs with medium, and especially high, movability are where big brands lose the usual advantage of their size, and the odds turn in favor of smaller competitors. On highly movable needs, big brands lose 2.6 times as often as they win.
Small and mid-sized brands break through 2.5 times as often on highly movable needs as on low-movability ones. For mid-sized brands alone, it is 2.8 times. No small brand founded in the last 30 years has broken through on a low-movability need.
This is where brands differ most, and where David can beat Goliath.
On highly movable needs, David can beat Goliath
Behavio (2026)
Figure 4
And these findings aren’t circular. We leave the brand itself out of the calculation and look only at its competitors’ positions: a brand’s own position cannot make the ground look more movable.
So one number answers two questions: movability measures how much competitors already differ on this need, but it also says how likely your brand is to break free from the position its size predicts. For small and mid-sized brands alike, the answers go hand in hand. That’s why we call such a need movable, not just moving.
The playbook that follows is simple: challengers should not look for a quiet gap where no brand is winning or losing. They should pick one of the big, active fights in their category and try to win it. Winning a fight is hard, but still easier than trying to win on dead ground.
Low-movability needs, where size predicts nearly everything, rarely reward challengers
One third of needs have low movability, and size predicts nearly everything. It’s tempting to assume that these needs are simply needs no brand has tried to claim yet. They may be unclaimed, but surely they’re not impossible to claim?
Yet many are exactly the kinds of associations that popular marketing advice has urged brands to promote for decades: deeper emotional benefits and buying occasions. Others are product needs where the main battle is already settled, and every credible brand in the category is expected to deliver. Think great taste in US colas, a morning energy boost in coffee, to refresh myself in cola, clear terms and conditions and feeling secure in insurance, and feeling like a good owner in dog food.
Category entry points tend to have low movability more often than other types of needs. None of the emotional needs we measured has high movability. Status, origin, and sustainability behave differently. We count them as symbolic needs, because they signal something to other people, and a third of them are highly movable. The same is true of CEP-like needs in cola and coffee: not a single one has high movability.
Behavio (2026)
Figure 5
We have seen that small brands cannot move low-movability ground. Big brands occasionally can, and so can mid-sized brands, although these are more often old brands, not new challengers. On a moment of calm and relax, only two brands hold a +6 earned strength across all markets: Douwe Egberts, a big brand, and Simon Lévelt, a Dutch coffee specialist founded in 1826.
A need with no fight in it is a trap for challengers, unless you have decades to spare
Breakthrough potential: the best need depends on brand size
Movability, occupancy, and prevalence all shape a brand’s chances of breaking through on a particular need. But the three rarely point to the same opportunity. Only 3% of brands have a silver bullet: at least one need that ranks first on all three dimensions. Every other brand must trade one strength against another.
Looking at how often small, mid-sized, and big brands break through on each dimension reveals which question each should ask first.
Small brands should prioritize highly movable needs, especially those with low occupancy. Prevalence matters less. A mainstream need would be ideal because it could give a brand room to grow from small to large around a single proposition. But less prevalent needs can still be a good choice, as long as they are highly movable and low in occupancy.
Mid-sized brands should follow the same order: prioritize movability first, then occupancy, and finally whether a need has medium or high prevalence. The one exception is low-prevalence, niche needs. To grow into a big brand, a mid-sized brand needs to win buyers it doesn’t reach yet. Niche needs simply don’t reach enough people, so they are best left aside.
For big brands, the question is less whether they can break through, and more where a breakthrough is worth the most. This flips the order of priorities: prevalence comes first. To keep growing, a market leader needs to reach buyers it doesn’t already have, and only mainstream needs offer enough of them. Occupancy comes next, with free needs first. On mainstream needs, big brands do better on low-occupancy needs than on occupied ones. Movability comes last because it involves a trade-off. A movable need offers a greater chance of winning, but also a greater risk of losing. So movability is a tiebreaker, not a data-driven priority. Whether to pursue it is a judgment call based on whether the brand needs to defend its position or win new ground.
The order of the three questions, by brand size
Behavio (2026)
Figure 6
Markets and categories differ widely in the potential they offer a brand. In US dog food, a small or mid-sized brand can target a need with potential #2 out of 27 combinations of movability, occupancy, and prevalence: sensitive digestion. It has high movability, low occupancy, and medium prevalence. The fight is still on, and the winners are yet to emerge.
In Dutch dog food, that fight is already settled. Sensitive digestion and natural food, the biggest battlegrounds in the US and UK, have low movability and are largely occupied. The best remaining option is #12, Netherlands produce. But it is a much harder starting point, and unlikely to support the rise of another major brand.
How growth hides the differentiation behind it
What if brands grow by building associations that their size alone cannot explain? Yet 90% of what people say about brands comes down to size. How could both be true?
Imagine launching a US dog food brand built for dogs with sensitive stomachs, cooked in facilities that make food for humans. A very promising proposition: sensitive digestion has high movability, isn’t yet fully occupied by existing players, and matters to enough dog owners to support at least a mid-sized brand.
You’re still a small brand, bought by just 2% of dog owners. You launch a great TV campaign, and 12% of dog owners now associate your brand with sensitive digestion. Only 3 of those 12 points are size-granted, what any brand of your size would typically get. The other 9 you truly earned. You’ve built a genuine point of differentiation.
Then the campaign ends. Most people who now associate your brand with sensitive digestion still don’t buy it. But over the following months, some give it a try. They may not switch to you entirely, but your brand makes their shortlist whenever their dog’s stomach acts up. Gradually, your buyer share grows from 2% to 5%.
Since the campaign ended, the number of people who associate your brand with sensitive digestion has stayed the same: 12 in 100 dog owners. But the benchmark has changed. A brand of your new size would typically be associated with sensitive digestion by 7% of dog owners. Other brands may never have actively built that association. It came naturally with the size they achieved by winning on other needs. You grew by winning on sensitive digestion. Yet from a brand research perspective, most of your original advantage has now disappeared. Of the 12% who associate you with sensitive digestion, only 5 percentage points still count as a distinctive strength.
As your brand grows, it gains associations beyond sensitive digestion. New buyers discover what your food is like when they feed it to their dogs. Their friends notice the bag, and your products appear on more marketplaces. With greater visibility and more buyers, people begin to associate your brand with the qualities and occasions they expect from any established dog food brand. Over time, they start buying you for reasons that have little to do with your original proposition.
Over time, you run more campaigns promoting sensitive digestion. Each one strengthens your lead, but each new wave of growth absorbs part of that advantage into your brand’s size. The cycle repeats until you’re so successful that everyone who cares about sensitive digestion already associates it with your brand.
But not every dog has a sensitive stomach. To reach the mainstream, you need to win on the needs that matter to the broader category. A decade or two later, you might be the market leader.
By the time a market researcher studies your brand, they may see a “shockingly” undifferentiated player, with associations on the category’s biggest, most established needs largely explained by its size. Even on sensitive digestion, the need that drove much of your growth, your brand may now score exactly as expected for its size. Your success has absorbed most of your original advantage.
Differentiation, then, is a growth path that can eventually erase the very advantage that started it.
Growth hides the differentiation that drove it
Behavio (2026)
Figure 7
Fortunately, our example market hasn’t reached that point yet. Sensitive digestion and natural food are still battlegrounds. Many challengers built around healthy, natural ingredients, most founded in the past two decades, have grown into mid-sized brands, and Blue Buffalo into a big one. They continue to promote their propositions through major TV campaigns, and their differentiation remains clearly visible in our data.
On natural food, Freshpet and The Farmer’s Dog in the US, and Lily’s Kitchen and Butternut Box in the UK, score up to 14 percentage points above what their size would predict. The market leaders, Purina in the US and Pedigree in the UK, have fallen behind, scoring up to 16 points below expectations.
Breakthrough potential passes an out-of-sample test
Small and mid-sized brands still retain much of the differentiation they have earned, so they are suitable for testing breakthrough potential. The strongest test is out of sample: can it predict results using data it has never seen?
In a hidden-market test, we used four markets to find the best order for assessing movability, occupancy, and prevalence, then tested it on the fifth. We repeated this five times, using each market as the hidden one in turn. For mid-sized brands, the same order won every time. Small brands had too few breakthroughs to establish a reliable order.
In a hidden-brand test, we took each of the 140 small and mid-sized brands out of the data in turn, then recalculated breakthrough potential without it. Needs in the top third broke through 2.8 times as often as those in the bottom third for small brands, and 2.1 times as often for mid-sized brands.
Undifferentiated challengers fall short on both awareness and conversion
But we didn’t just look for evidence that differentiation drives growth. We also tried to disprove it by looking for brands that grew through pure distinctiveness: brands that became easy to recognize and recall, without standing for anything specific. If that playbook worked, standing out on a particular need would have no bearing on how well-known a brand was or how often people bought it.
But our findings point in the opposite direction: among small and mid-sized brands, differentiated ones are better known, and they convert more of that awareness into buyers.
The pattern holds beyond this study, too. In our brand trackers with three or more waves, growing brands improve, on average, on 1.6 of every five associations tracked.
Behavio (2026)
Figure 8
Overall, we found little evidence of brands growing through pure distinctiveness: being much better known than their size would predict, with distinctive brand assets and standout advertising, but no clear strengths in their product or the other Ps. Of the 246 brands we studied, only two came close. Both were small, and neither was growing.
The other obvious candidates, brands far more famous and distinctive than their size would predict, are also strongly differentiated. Tesla is the clearest case: far above its size on distinctive brand assets and standout advertising, and on product needs such as environmentally friendly too.
Converted differentiation: from one need to broad availability
None of this proves that a brand can’t grow on fame alone. It suggests that doing so is very ineffective. Fame and distinctive brand assets seem to work much better when they support a clear lead on a specific need, chosen based on movability, occupancy, and prevalence, in the order that makes sense for your brand’s size.
Nor is this a step back to classic differentiation. The difference does not have to be unique, and once you are big, it is no longer the main reason people choose you.
This growth path is perhaps best described as converted differentiation. You need a difference to grow efficiently, and over time you cash it into broad mental availability.
Three playbooks for growing a brand
DifferentiationKotler, Ries, and Trout
DistinctivenessEhrenberg-Bass
Converted differentiationThis study
In short
Choose your gap
Choose your look
Choose your fight
Brands grow by
Being meaningfully different
Becoming famous through mass, distinctive communication
Becoming famous above their size on needs where the fight is still open
Playbook depends on brand size
No
No
Yes
How to choose the message
Find a relevant difference no rival claims, and repeat it
Rotate messages to be known across a wide spectrum of category entry points
Pick the strongest messages on movability, occupancy, and prevalence, in the order the brand’s current size sets
As the brand grows, its difference
Should last
Was never the point
Converts into broader mental availability across many needs
Why buyers choose big brands
They are different
They come to mind easily, on many needs
They come to mind easily, on many needs
Behavio (2026)
Figure 9
Everything else in this paper adds detail, examples, and numbers to what you have just read.
The study
246 brands, 5 markets, 60,000 respondents
246 brands in 8 categories: cars, cola, packaged coffee, dog food, electronics retail, insurance, streaming, and supplements.
5 markets: the US, the UK, Germany, the Netherlands, and Czechia. That makes 40 category markets, with about 6 brands each.
60,000 respondents, 1,500 nationally representative per category in each market. Every number in this paper is a share of category buyers, not of the whole population. Fieldwork: June to August 2026.
775 needs, about 20 per category market, across the 4Ps: occasions, functional, emotional, and symbolic needs on product, plus price, place, and promotion. In total, 4,758 brand–need scores. For every product need, buyers also said whether it matters when they choose. Chapter 3 explains why all 4Ps belong in mental availability.
Brand metrics: penetration (bought in the past year, or the past 10 years for cars), prompted awareness, unprompted recall, consideration, liking, and open-ended associations.
Small, mid-sized, and big brands: bought by under 10% of category buyers (49 brands), 10–29% (91), and 30% or more (106).
The findings rest on two methods that remove two typical biases of a standard attribute study.
Random speeded pairs. Most attribute studies show respondents either one brand alongside a list of attributes to rate, or one cue alongside a list of brands to select. In both formats, answers influence one another. The brands shown, and the order in which they appear, can change responses. This creates uneven bias for well-known and lesser-known brands, exactly the problem we needed to avoid. Instead, respondents saw one cue and one brand logo at a time, presented in random order, and answered yes or no. We excluded responses that took more than 3 seconds. Each answer stood alone, so we could add or remove a brand or cue without affecting the others. Even when we reduced the questionnaire from about 20 cues to 12, 8, or 6, the remaining cues correlated with the full version at 0.99 or higher. Chapter 4 describes the method in detail.
Size adjustment: a separate curve for every need. Brand size predicts associations differently for different needs, so a single adjustment for each brand would be inaccurate. We therefore fitted a separate curve for every need in every category and market, using a hierarchical logistic regression model. Chapter 4 explains the method in detail. The most widely used approach to adjusting brand associations for size, mental advantage, uses a model in which all scores sum to zero. This can create artificial strengths and weaknesses for brands that perform strongly or weakly overall. Applied to our data, it would have reversed 11% of the strengths and weaknesses we identified.
Chapter 1
Once size is removed, rival brands differ clearly in buyers’ minds
Sharp argues that most of what appears in a brand image table comes down to size: big brands have more buyers, and those buyers tend to associate them with more things. As he writes in How Brands Grow, “Once the usage effect is removed, there is little sign of brands having unique images.”
Our data tells a more nuanced story. In this chapter, we show that although 90% of brand associations can be explained by size, differentiation is neither rare nor “shockingly low.” Most brands have clear strengths and weaknesses, and these often differ substantially from those of their competitors.
1.1 Most associations come with size; the rest are earned
Does Coca-Cola taste great? 75% of American cola buyers think so. Only 6% say the same about Virgil’s Cola. It is hard not to read that as a verdict on flavor.
Great taste in US colas is granted by size
Behavio (2026)
Figure 10
The likely explanation lies in how people answer. When a need feels typical of the category, and a brand feels typical of the category, people answer yes even without a concrete memory link. This happens in surveys, and probably at the shelf, too. We call these associations size-granted: they come with being big.
The chart shows that the number of buyers almost perfectly predicts how often people associate a brand with a need. But those making the associations are not just buyers. Many are non-buyers, especially for small and mid-sized brands. Even among non-buyers, however, associations tend to follow the number of people who buy the brand.
Non-buyers pick up clues about a brand’s size from seeing it on shelves, on marketplaces, and in their friends’ hands and homes. In other words, it is not just fame that shapes these associations, but people’s sense of how big a brand is. Awareness alone predicts size-related associations less accurately than buyer numbers do.
Tesla illustrates the point. About 80 in 100 car buyers know the brand, yet on typical car needs, its associations are no stronger than its relatively small buyer base would predict. A famous name is not enough.
Non-buyers also explain why the line is not straight but bends. Each new buyer lifts a small brand’s score more than a big brand’s. Economists call this diminishing returns.
When a small brand wins its first buyers, many more people start hearing about it and associating it with the category’s typical needs. When a big brand wins another buyer, that person likely already associated it with those needs before buying.
There is also a ceiling. No brand is linked to a need by everyone. Even Coca-Cola reaches only 75%.
For great taste in US colas, size explains the entire score. This does not mean that no one genuinely loves the taste of Coke, but all such people sit among the many who would have said yes anyway, so their love does not move the score. No cola owns a real position on taste.
Now, what does it look like when size alone can’t explain the score? Let’s look at US electronics stores, and whether people link them to expert advice.
Expert advice in US electronics is not explained by size
Behavio (2026)
Figure 11
Best Buy is bought by fewer electronics buyers than Amazon. Yet 64% link Best Buy to expert advice, against 37% for Amazon. On the cola chart the bigger brand always scored higher; here a smaller store scores 27 points more.
Even for Best Buy, 50 points of its score come with its size. The other 14 are truly earned: links Best Buy has built for itself. In people, that’s roughly 13.7 million US electronics buyers more than a store of its size would typically get.
Earned positions can also be negative. Some people who would agree based on brand size actively disagree. For Amazon, that deviation is 21 points: roughly 21.1 million US electronics buyers who don’t see it as a place for expert advice.
What respondents likely think when they click yes or no
So if your brand tracker shows only raw scores, you are mostly looking at your market share with dozens of needs written along the top. That’s a costly way to measure market share.
1.2 Every category, and most brands, hold earned positions
On any given need, a typical brand sits 4.2 points from where its size would put it. Most of that is noise: with a fresh sample of 1,000 people, scores would shift by a point or so, like a bathroom scale that never quite agrees with itself. But the big gaps are far too common to be down to chance:
Most brands have at least one big gap from their size norm
Deviation from the size norm
Brands with at least one such gap
Share of all measurements
Over 5 points
83%
31%
Over 10 points
50%
8%
Behavio (2026)
Figure 13
And these gaps rarely come alone. Within a typical brand, its strongest and weakest needs sit 17 points apart. Three brands in four have both a clear strength and a clear weakness: a need people associate with them more than their size would predict, and one they associate with them less. Specifically, they score more than 3 points above their line on one need and more than 3 points below it on another. We call these earned strengths and earned weaknesses.
A point looks small on a slide, but every point is a share of the people who buy the category. A modest earned position is a crowd the size of a city; bigger ones on bigger markets are dozens of millions of people.
Large earned positions, in number of category buyers
Behavio (2026)
Figure 14
Some categories leave more room for brands to stand apart than others. Electronics and cars are at the loud end, with the typical brand sitting about 5 points off its line. Supplements and insurance are at the quiet end, at about 3.5 points. This difference is not down to electronics having bigger and smaller brands. How unequal brands are in size has virtually no relationship with how far they stray from their lines (a correlation of −0.05, as close to no link as the data gets).
How much brands differ, category by category
Behavio (2026)
Figure 15
Here is what this looks like within a single category: American cars, with brand size taken out of the equation. Each cell shows the share of car buyers who link a brand to a need beyond what its size alone would predict. A blank cell means size explains the association entirely.
Cars: what a strongly differentiated category looks like
Behavio (2026)
Figure 16 · Points above or below what each brand’s size predicts, US cars. Blank cells are within ±3 points.
Cadillac owns status, but pays for it on price. Tesla owns technology and green credentials, Toyota owns value, and Ford owns the showroom. Chevrolet, the biggest of the six, owns almost nothing of its own. Where it stands out, it is by falling short: on status, design, and the environment.
Cars are easy to tell apart. People argue about them, and carmakers spend fortunes trying to stand out. Coffee, by contrast, sits on a supermarket shelf and gets bought half asleep. UK coffee is one of the flattest categories we measured.
Coffee: even the flattest category still has plenty of earned positions
Behavio (2026)
Figure 17 · Points above or below what each brand’s size predicts, UK coffee. Blank cells are within ±3 points.
The patches are smaller, but each brand still has one: Tesco Finest on price, Douwe Egberts on the supermarket shelf and the comfort of the cup, Taylors of Harrogate on feeling special. Grind is the brand nobody links to the shelf.
1.3 Competing brands rarely share the same strongest association
As the two grids show, each brand stands out on different needs. The same pattern holds across the full study.
Competitors rarely share the same strongest association. For 70% of brands, no rival has the same top strength. And half of all strengths of 6 points or more belong to just one brand.
The pattern holds for product needs, too. In a typical category of six brands, four have a strongest product association that no rival shares. Only two share their top strength with another brand.
Brands also stand apart across the full marketing mix. Roughly a third have their biggest strength in price, a quarter in promotion, a quarter in product, and a fifth in place. In every market we studied, competitors’ strongest associations spanned at least three of the four Ps.
1.4 Non-buyers see earned positions too
Before claiming that earned positions matter for growth, we need to address one objection. These differences could simply reflect what customers say about brands they already buy. People who subscribe to Viaplay know what is on it, while those who don’t might see all streaming services as much the same. If so, earned positions would be a record of past purchases, not a route to new ones.
Yet people who don’t buy a brand account for 44% of all the links made to it. For brands bought by fewer than 20% of category buyers, it is 69%, and for earned positions above +10, 54%. In the Netherlands, 46% of streaming buyers link Viaplay to watching sports, yet only 17% subscribe. 36 points of the 46 come from people who have never paid for it.
We also compared non-buyers with the whole sample. Across 1,482 brand–need pairs, the share of non-buyers who link a brand to a need tracks the share of all buyers in the category with a correlation of 0.92. On the 179 pairs where a brand sits more than 6 points above its line, the correlation is still 0.89.
Chapter 2
Differentiation matters for growth
Size explains 90% of brand associations, which helps explain why market shares are so stable. Bigger brands come to mind across more of the category’s buying triggers, making them more likely to stay big.
In this chapter, we’ll show why the remaining 10%, the earned associations, matters for growth. It’s where brands can move beyond the position their size would normally predict and find room to grow.
But first, we test whether a brand can gain size-granted associations without earned ones, simply by becoming famous enough to appear bigger than it is.
2.1 Brands that grow on fame and distinctiveness alone are hard to find
How Brands Grow opens by telling anyone who believes that “differentiating our brand is a vital marketing task” that they are “operating under many false assumptions.” Instead, Sharp advises marketers to build mental and physical availability. Mental availability comes from “sophisticated mass marketing,” supported by distinctive brand assets such as logos, fonts, and colors, that help people recognize and remember the brand across a wide range of category entry points (CEPs). In this view, a brand’s links to CEPs come mostly with its fame, not with which CEPs it chose to advertise. That leaves brands with considerable freedom in which CEPs they communicate. Over time, they should rotate through the category’s most mainstream CEPs and potentially address those where they lag behind.
If this playbook worked, standing out on a particular need would have no bearing on how well-known a brand was or how often people bought it. But, as we’ve already shown, our findings suggest the opposite. Let’s examine the evidence in more detail.
Differentiated brands are better known. Small and mid-sized brands with an earned strength above +6 on a product need are known by 0.6 points more people than their size predicts. Comparable brands without such an earned strength are known by 3.3 points fewer. That is a gap of about 4 points.3 The pattern holds across all eight categories.
Differentiated brands are better known
Behavio (2026)
Figure 18
Differentiated brands convert more awareness into buyers. Brands with an earned strength among people who know them but don’t buy them turn more of their awareness into buyers. Their conversion is about 8 percentage points higher than that of equally well-known brands without one: roughly 17% more buyers, and over 20% more for small and mid-sized brands.4
Growing brands strengthen specific associations, not their entire image at once. Beyond this study, our brand trackers show a similar pattern. Across trackers with three or more waves, growing brands improve, on average, on just 1.6 of every five associations measured.
Overall, we found little evidence that brands grow through pure distinctiveness alone. By this, we mean being far better known than their size would predict, thanks to distinctive brand assets and standout advertising, but without clear strengths in the product or other Ps. Of the 246 brands we studied, only two came close to fitting this pattern: Suri in Czech insurance and Davidoff in Dutch coffee. Both were small, and neither was growing.
Other obvious candidates are brands that are far more famous and distinctive than their size would predict. But they also tend to have clear strengths on product needs.
Take Tesla. Most car buyers know the brand in every market, yet few of them buy it. Tesla also scores far above expectations on distinctive brand assets and standout advertising. But it stands out on product needs, too, scoring up to 18 points above expectations for environmentally friendly, and up to 20 points on packed with features and a sense of status. On many other typical car needs, however, it scores below expectations.
65 small and mid-sized brands with an earned strength above +6 on a product need and 75 without. The gap is positive in all eight categories (1 to 9 points) and in 23 of 29 market-by-category comparisons. p < 0.001. Earned strengths measured with each brand left out of its own line. ↩
150 brands in Czechia, the Netherlands, and the UK (128 with an earned strength, 22 without), the markets where buyers and non-buyers can be told apart. An earned strength here means scoring more than 6 points above the brands’ average on at least one need, among people who know the brand but don’t buy it. Expected conversion comes from a curve of penetration against awareness, with one slope for all 40 categories and a level for each. p < 0.001. ↩
2.2 Typical attribute studies weigh prevalence and occupancy but miss movability
Let’s look more closely at how differentiation can drive growth. Return to our dog food founder in the early days, deciding which proposition gives the brand the best chance to grow.
What a typical attribute study reports: links vs importance
Behavio (2026)
Figure 19
A differentiation-school strategist could choose exactly for my dog based on this simple reading of the attribute table. Or they could choose low price, the second-widest gap, and follow the classic low-price strategy. In practice, more sophisticated approaches use the data to identify which needs cluster within different segments, how much those buyers spend, and which audiences the brand can realistically reach. Those factors may point to a different need.
But the underlying logic is the same: how much a need matters, and how much room there is for a brand to claim it. Both are important. They reflect two of our three growth principles: prevalence and occupancy.
Yet a third characteristic matters even more. Some needs, like exactly for my dog, may look promising on these two dimensions, but no matter how well you target them, you may never build distinctive associations around them. We call this principle the movability of a need.
2.3 Movability: challengers win where rivals already differ
Movability asks a simple question: how far do competitors sit from the position their size would predict? But this isn’t just about which brands have chosen to stand out. It reflects something inherent to the need itself: how much room it gives any brand to build an earned position. Of the three dimensions, movability is the strongest predictor of where small and mid-sized brands can hold earned strengths.
How is movability measured?
How far, on average, the other brands in the category sit from the score their size predicts. The brand itself is left out, so its own result cannot make the need look more movable.
Consider these pairs of needs. Imagine they have the same occupancy and prevalence. Where would a new player find it easier to compete: where brands have already moved beyond what their size predicts, building clear strengths and weaknesses, or where no brand has managed to break away from what size alone would predict?
Low movability vs high movability
Behavio (2026)
Figure 21
At first glance, the left-hand need seems more tempting. No brand stands out on it, so the first to do so might claim the territory for itself. An untouched island.
But as we argued in the introduction, needs dominated by size are not untouched islands waiting to be claimed. They are settled ground where brands struggle to stand apart. How can we tell?
Where competitors already differ, challengers hold far more strengths.
Small and mid-sized brands are 2.5 times as likely to hold a +6 earned strength on a high-movability need as on a low-movability one; for mid-sized brands alone, it is 2.8 times. Small brands on their own hold such strengths on low-movability needs too rarely to give a reliable ratio.
Highly movable product needs account for just 14% of all brand–need pairs, yet they represent 36% of major breakthroughs, where brands score more than 10 points above expectations.
This could be circular: a brand’s own distinctiveness might make a need look more differentiated. Real estate agents know a simple test. Hide a house’s price. If you can still guess it from the street it stands on, location matters. If not, it is all about the house.
We applied the same logic to brands. We set each brand aside in turn, excluding it entirely from the calculation. Using only its competitors, we measured how much brands differed from what their size would predict, for each need in the category.
We then compared two needs for the brand we had set aside: one where it broke through, scoring at least 6 points above the norm for its size, and one where it did not. Because both needs belonged to the same brand, differences in its size, budget, or overall strength could not explain the result.
In 62 out of 100 pairs, the need where competitors differed more was also the one where the brand broke through. By chance, we would expect around 50, with a maximum of 52.
That is why we call it movability. Whether a brand can move on a need depends not just on the brand itself, but also on the ground it is trying to claim. Low-movability ground is not impossible to move, but it rarely happens.
Leaders are more likely to lose ground there, while challengers gain it.
On highly movable needs, big brands lose ground 2.6 times as often as they gain it. Of 145 such brand–need pairs, 53 sit more than 6 points below what their size predicts and only 20 more than 6 points above. Small and mid-sized brands, on the other hand, have 1.25 times more wins than losses on highly movable needs.
Small brands almost never break through on low-movability needs.
On low-movability needs, not one small brand founded in the past 30 years broke through. Only two small brands did: Film1, a brand with roots in the 1980s, and Okay Electronics, founded in 1994 and recently closed.
Big and mid-sized brands occasionally move low-movability ground, but far less often than movable ground. And the mid-sized brands that do it are more often old: 9 of the 17 were founded before 1950.
What follows? Small and mid-sized challengers should prioritize movable needs. For a big brand, movable ground is a bet. On dead ground of low-movability needs, its size-granted position is well protected. On movable ground, that protection disappears, and rivals can take whatever it has not built for itself. But the brand can also pull ahead there.
2.4 Core category emotions and basic occasions tend to have low movability
Across the study, 36% of brand–need pairs have low movability: brands sit, on average, less than 3 points from what their size predicts.
These “dead” needs follow a pattern. Many are basic category occasions and functions: morning energy boost in coffee, to refresh myself in cola, or clear terms and conditions in insurance.
Others are deeper emotional needs that are central to the category: feeling like a good owner in dog food, feeling secure in insurance, to feel alive in cola, or to feel confident in supplements.
Across the study, brands hold strengths on emotional needs in 9.2% of cases, against 12.9% expected by chance.
Why do these needs follow size so closely? Not because brands have ignored them. Category functions have featured in advertising for decades, and brands have spent just as long trying to own deeper emotional needs.
Taste in cola sparked one of marketing’s most famous battles. In 1975, the Pepsi Challenge pitted Pepsi against Coca-Cola on taste, winning over some Coca-Cola drinkers. In 1985, Coca-Cola hit back by changing its recipe to launch New Coke, only to bring back the original formula less than three months later.
Two of the world’s biggest advertisers fought over taste for a decade, yet neither managed to own it. Today, every American cola brand sits within about 3 points of its predicted score for great taste, right where its size would put it.
It seems to come down to three factors:
1. The fight is settled. Brands have pushed the same need for years, and each brand’s gains have been matched by its rivals’.
2. The need is too typical of the category. Buyers see it as a basic expectation, not something that sets one brand apart from the rest.
3. Emotional needs need concrete support. In the rare cases when an emotional need that usually has low movability becomes movable in one market, the brand usually stands out on more concrete needs, too. Of the 20 brands that break through on an emotional need, 18 also break through on a concrete product need. In the UK, Butternut Box stands out for making people feel like good pet owners, as well as for natural food, high meat content, and sensitive digestion.
What kinds of needs are most likely to be movable? Some are symbolic, such as status, design, environmental friendliness, and country of origin. Unlike emotional needs, these can signal something to other people: a third of symbolic brand–need pairs have high movability, against none of the emotional ones. Others are functional, such as installation services, expert advice, kids’ profiles, and being gentle on the stomach.
Movability is not limited to product needs. Price, place, and promotion cues can be highly movable, too.
2.5 Occupancy: free needs offer room that occupied needs do not
Occupancy asks whether the market is meeting what buyers want. Some needs matter to many buyers, yet few brands are associated with them. Others are overcrowded, with brands claiming more associations than buyer demand would justify.
How is occupancy measured?
Occupancy compares two things: how strongly brands are linked to a need, and how many buyers say it matters. Where brands are linked more than the need’s prevalence suggests, the need is occupied. Where they are linked less, it is free. A brand’s needs are ranked by how much room they leave and split into thirds. The detailed calculation is in the appendix.
Imagine you are a manager at Apple TV, which reaches 23% of streaming buyers in the UK. You need to decide whether to buy sports rights or kids’ content rights to attract subscribers. Both needs are movable, and both matter to a similar number of people. But there is another factor: kids’ content looks like a more crowded space, with more competition from other brands.
Sport is underoccupied in UK streaming; kids’ profiles are occupied
Behavio (2026)
Figure 23
A typical service reaching one-fifth of buyers is associated with kids’ profiles by 29% of buyers, and with sport by 23%, even though more buyers care about sport. Sport is underoccupied: buyers want more of it than services are known for. Kids’ profiles, by contrast, are already occupied. Every service in the category falls on the same side.
Free ground is where the market has yet to catch up with buyer demand. A brand that moves into this space can meet demand that is already there, without competing head-to-head with established players. NOW, a service the same size as Apple TV, sits 12 points above its size-predicted position on sport.
Small and mid-sized brands break through more often on low-occupancy needs, but the effect is smaller than for movability: 1.2 times for small and 1.5 times for mid. For big brands, the better ground depends on how prevalent the need is. Overall, they do better on high-occupancy needs, mostly on the less prevalent ones. On mainstream needs, low-occupancy needs give them more wins per loss (2.0 against 1.4).
2.6 Prevalence: a need’s reach matters most for big brands
Prevalence is the share of category buyers who say a need matters when choosing. It tells you how much a breakthrough on that need is worth. It is also the only one of the three dimensions recognized by the Ehrenberg-Bass school, which ranks category entry points by how many buyers each one reaches.
How is prevalence measured?
We ask category buyers whether a need matters when they choose. Prevalence is the share who say yes.
Prevalence matters most to big brands. A leader already sells to most of the category, so it should focus first on the needs that matter to the most buyers, turning to niche needs only after that. MediaMarkt reaches 63% of Dutch electronics buyers. High-quality products matter to 83% of buyers, while installation services matter to 45%. Both needs are highly movable, and MediaMarkt sits on its line on both. If installation became its main story, MediaMarkt would be building its brand around a need that matters to fewer people than already shop there. It would be narrowing its appeal to that of a specialist. The specialists are already there. Expert, which reaches 18% of buyers, sits 24 points above its line on installation, while Coolblue sits 16 points above. For Expert, the same need is two and a half times its size.
Prevalence does not change the odds of holding a strength, but big brands are more likely to fall behind on niche needs.
For small brands, prevalence matters least. Even the least common need in our study matters to 24% of buyers, while a small brand reaches fewer than 10%. Every need is bigger than the brand itself, so small brands hold earned strengths on niche needs about as often as they do on mainstream ones.
2.7 Breakthrough potential: small, mid-sized, and big brands should ask the three questions in different orders
Three questions shape a brand’s chances of breaking through on a particular need. Movability asks whether brands already differ on the need at all. Occupancy asks whether there is still room to build associations around it. Prevalence asks whether the need is big enough to drive growth.
The three questions rarely point to the same opportunity. Only 3% of brands have a silver bullet: at least one need that ranks best on all three dimensions. Every other brand must trade one strength against another. But the patterns in where brands of different sizes build earned strengths, and where they fall short, reveal which questions each should ask first.
Small brands: movability >occupancy > prevalence
Why this order? Almost no small brand has broken through on a low-movability need, so choosing a mainstream need with low movability would be a recipe for failure. A small brand should first ask whether a need is movable, and consider only those that are. Next, it should look for movable needs that are also free. Small brands hold earned weaknesses 1.7 times as often on occupied needs as on free ones.
Prevalence comes last. A need that is movable, free, and mainstream would be ideal: it could give a brand enough room to grow from small to large on a single proposition. But such needs are extremely rare. Most small brands will need to start with movable, free needs that are more niche. Only as they grow into mid-sized players should they shift toward more mainstream propositions.
To keep things simple, we divide the answers to each question into three bands: high, medium, and low. This gives us 27 possible combinations of the three dimensions. We then rank these combinations by movability first, occupancy second, and prevalence third, giving each need a breakthrough potential score from 1 to 27:
Breakthrough potential for small brands
Behavio (2026)
Figure 25 · Only the top branch is opened down to single needs. The small forks mark the splits that repeat in every other branch.
A need ranks #1 if it is high-movability, low-occupancy, and high-prevalence. High-movability, low-occupancy, and mid-prevalence needs rank second, followed by high-movability, low-occupancy, and low-prevalence needs in third place. Next come high-movability, mid-occupancy needs, regardless of prevalence (ranks 4–6), followed by high-movability, high-occupancy needs (7–9).
If no high-movability needs are available, the next best options are mid-movability needs (10–18). Low-movability needs rank last (19–27), and offer very little chance of breaking through.
Here are the top two and bottom two needs for a small brand in two categories, along with their ranks:
For small brands, movability decides which needs rank first
Behavio (2026)
Figure 26
Opportunities for challengers vary widely across markets and categories. In Germany, a small cola challenger’s best opportunity ranks #3. In the Netherlands, it ranks #10. In the US, it ranks #12, because no product need in the cola category is movable.
Mid-sized brands: the same order, without low-prevalence needs
A mid-sized brand first sets aside low-prevalence needs, those that matter to fewer than 60% of category buyers. To become a big brand, it needs to win buyers it doesn’t reach yet, and niche needs simply don’t reach enough of them.
It then ranks the remaining needs just as a small brand does: movability first, occupancy second, and prevalence third, using the two remaining prevalence bands.
Why the same order? Mid-sized brands do sometimes break through on low-movability needs, unlike small brands. But movability still matters much more than occupancy. A mid-sized brand is 2.8 times as likely to break through on a high-movability need as on a low-movability one, but only 1.5 times as likely to break through on a free need as on an occupied one. So when it has to choose, a high-movability, high-occupancy need is a better bet than a low-movability, low-occupancy one.
Both remaining prevalence bands, mid and high, are large enough to take a mid-sized brand to large. So prevalence comes last.
With this ranking, low-prevalence needs occupy ranks 19–27, while all other needs rank from 1 to 18:
Breakthrough potential for mid-sized brands
Behavio (2026)
Figure 27
Here are the top two and bottom two needs for a mid-sized brand in two categories, along with their ranks:
For mid-sized brands, niche needs drop to the bottom
Behavio (2026)
Figure 28
Big brands: prevalence > occupancy (low occupancy first) > movability
For a big brand, breakthrough potential is less about whether it can break through. Leaders hold an earned strength on about one need in four, almost regardless of the need. It is more about where a breakthrough is worth the most.
That flips the order: prevalence comes first. To keep growing, a leader needs to reach buyers it doesn’t already have, and only mainstream needs offer enough of them. Niche needs are also where leaders fall more than 6 points behind, 3.7 times as often as on mainstream needs. A leader that focuses on niche needs risks shrinking below the position its size would predict, and starting to look like a specialist.
Occupancy comes next, with free needs first. On mainstream needs, big brands win twice for every loss on free needs, against 1.4 times on occupied ones. On less prevalent needs, they do better on occupied ones, but those needs come last in the ranking anyway.
Movability comes last because it involves a trade-off. A movable need offers a bigger chance of winning, but also a bigger risk of losing. Big brands break through on movable needs twice as often as on low-movability ones, but also fall behind 3.7 times as often. That makes movability a tiebreaker, not the first priority. Low-movability needs are the safer choice; movable needs are the riskier bet. The ranking puts movable needs first because the goal is to keep growing, not simply to hold on to existing ground.
Sorted this way, a big brand’s needs line up like this:
Breakthrough potential for big brands
Behavio (2026)
Figure 29
Here are the top two and bottom two needs for a big brand in two categories, along with their ranks:
For big brands, the needs that matter to most buyers rank first
Behavio (2026)
Figure 30
Side by side, the three orders look like this, as in Figure 6:
The order of the three questions, by brand size
Behavio (2026)
Figure 31 · Repeated from Figure 6.
Breakthrough potential is a starting point for strategy, not a brand’s final priority list. It reflects what one snapshot of the market tells us about each need, while marketers bring context the data cannot capture. One need may be growing quickly while another is losing relevance. A brand may not be able to deliver what buyers want. Or one need may offer far greater revenue or margin potential than another.
That’s why a need with higher breakthrough potential may sometimes be ruled out, while one with lower potential moves up the list.
A challenger has to focus its limited resources on one need. A leader, by contrast, typically runs several campaigns at once, choosing a set of needs that work well together. This makes the decision more complex and leaves room for exceptions. Focusing entirely on a niche need would risk shrinking a leader’s position. But a carefully chosen niche need can complement two mainstream ones.
2.8 Hidden-brand and hidden-market tests: the model predicts where challengers hold strengths
The strongest way to test whether breakthrough potential works is to see if it can predict data it has never seen. This is called an out-of-sample test. The usual shortcut is an in-sample test, which builds a measure and tests it on the same data. The results almost always look good because the measure is tailored to that particular dataset, including patterns that may not hold anywhere else.
So far, we’ve used all our data to estimate the chances, leaving no fresh data to test those estimates against. But there’s a simple solution: hide part of the data, one brand or even one entire market at a time. Then recalculate breakthrough potential without it. Finally, reveal the hidden data and see how well the rest of the data predicted it.
Hidden-brand test
We test whether a hidden brand actually holds more earned strengths on the needs ranked highest by its breakthrough potential than on those ranked lowest. To do this, we calculate the brand’s breakthrough potential using only the other brands, leaving the brand itself out of the analysis.
This test applies only to small and mid-sized brands. Big brands break through on many needs, so the more important questions are where they fall behind and how much each potential breakthrough is worth.
One by one, we removed all 140 small and mid-sized brands from the data: 49 small brands and 91 mid-sized ones. We made our predictions without each brand, then added it back to see how well they held up.
The results: small brands held a +6 earned strength on needs in the top third of their breakthrough potential 2.8 times as often as on needs in the bottom third. For mid-sized brands, the difference was 2.1 times.
Three of the 140 experiments:
Orthomol: its two top-ranked needs are its two strongest positions
Behavio (2026)
Figure 32
Then we revealed the brand: Orthomol, a German supplement brand on the market since 1991. Its two highest-ranked needs turned out to be its two strongest positions, both 11 points above the level predicted by its size.
Tesla leads on its highest-potential needs and trails on its lowest
Behavio (2026)
Figure 33
Tesla, in German cars since 2009. It sits 14 points above its size-predicted position on environmentally friendly and 9 points above it on a sense of status, its two highest-ranked needs. On its two lowest-ranked needs, it falls 7 and 5 points below its size-predicted position.
The Farmer’s Dog: its two top-ranked needs are its two strongest positions
Behavio (2026)
Figure 34
The Farmer’s Dog, a US subscription dog food brand on the market since 2016. Its two strongest product positions are also its two highest-ranked needs: 13 points above its size-predicted position on natural food and 10 points above it on sensitive digestion. It holds earned strengths on every product need, including its two lowest-ranked ones.
Hidden-market test
Here we test whether movability, then occupancy, then prevalence is the most predictive order for small and mid-sized brands. We also go one step further and challenge our own assumptions.
The hidden-brand test left out each brand when calculating its breakthrough potential, but it still used an order of the three questions chosen based on all brands. What if that order was wrong?
This time, we tested all 12 possible combinations. The three questions can be asked in six different orders, and for occupancy, we can prioritize either free or occupied needs. Each time, we used four of our five markets to identify the best order, then tested it on the fifth, hidden market. We repeated this process five times, hiding a different market each time.
For mid-sized brands, the same order came out on top every time: movability, then occupancy, then prevalence. For small brands, movability came first in three of the five markets. But there were too few breakthroughs to determine whether occupancy or prevalence should come second.
Together, the hidden-brand and hidden-market tests provide the strongest validation possible with a single wave of data. They show that the associations a brand builds matter, and that, at least for challengers, the choice is not arbitrary.
2.9 The growth cycle: how differentiation lifts challengers, then disappears
How well do these numbers actually reflect what happens in a category? US dog food offers one example.
For decades, Purina and Pedigree dominated the category. But this century, several challengers, including four in our study, broke through: Blue Buffalo, Freshpet, The Farmer’s Dog, and Taste of the Wild. Each has built a sizable buyer base since it was founded.
Their stories have a lot in common. Each started with the same belief: ordinary kibble was not good enough. But each found a different way to challenge it.
In 2003, a family whose dog had cancer couldn’t find food they trusted, so they made their own. Blue Buffalo was born, offering natural kibble with real meat as its first ingredient.
In 2006, three pet food industry veterans took a different approach. They founded Freshpet, ditched kibble altogether, and began selling fresh, cooked food from refrigerated units in grocery stores.
Then, in 2015, a New Yorker whose dog kept getting an upset stomach was advised by her vet to cook for her. That home cooking became The Farmer’s Dog. After more than 200 manufacturers turned them down, they found a human-food factory to produce their meals and began delivering them directly to customers by subscription.
Taste of the Wild was the exception. Unlike the other three, it came from an established pet food maker. Launched in 2007, it built on the grain-free recipes of a few smaller pioneers, drawing on the idea of an ancestral diet.
Four brands, four different answers to the same question: what does healthy, natural food for dogs look like? Each has carved out a distinct position in the market. Here’s where those positions stand today:
Healthy, natural dog food: each challenger leads on different needs
Behavio (2026)
Figure 35
Does that mean The Farmer’s Dog has been the most successful brand in healthy, natural dog food? No. It means only that The Farmer’s Dog currently has the strongest position in buyers’ memories.
To understand why, let’s return to the growth cycle introduced earlier. When a brand builds associations in buyers’ memories beyond what its size would predict, it moves through five steps:
1) Earn. The brand builds associations beyond what its size would predict. Most of these come from people who don’t buy it yet.
2) Convert. Some of those people become buyers.
3) Absorb. As the brand grows, more people encounter it: on more shelves, in friends’ homes, and across more online stores. Buyers and non-buyers alike begin associating it with the same needs they associate with established dog food brands, far beyond its original proposition. Its line rises across every need, including the one that first set it apart. The original advantage is absorbed into the associations that come with greater size, and the difference disappears.
4) Get copied. Once a challenger proves that a particular need can drive growth, competitors typically move into the same territory. This further erodes the brand’s original advantage.
5) Settle. The need becomes established territory. Every brand sits close to the level of associations its size would predict. To keep growing, the brand must find another need to break through on.
The Farmer’s Dog sits between the earn and convert stages. Its position in buyers’ memories runs well ahead of its sales, so more of its growth potential is still stored in people’s minds than for any other brand in this comparison.
Two things stand between that memory and sales. The first is time: people change their dog’s food only occasionally. The second is availability: The Farmer’s Dog falls below the level its size would predict on being easy to buy in stores and available in supermarkets.
In March 2026, the brand started selling through Walmart.com, reducing one of these barriers and giving more of its earned memory a chance to turn into sales. Getting onto physical store shelves would likely be its biggest growth opportunity right now.
The Farmer’s Dog is in a strong position right now, and the more competitive the need, the stronger its advantage:
The more movable the need, the bigger The Farmer’s Dog’s earned lead
Behavio (2026)
Figure 36
Breakthrough potential points to sensitive digestion ahead of natural food. The reason: sensitive digestion is still an open space, while natural food is already occupied by competitors. This fits the brand’s stated targeting of owners whose dogs have health issues, including digestive problems.
Yet its TV ads focus on real food, freshness, and longer lives, rather than digestive health. This could explain why its lead on sensitive digestion is smaller than its lead on natural food. A more focused message around digestive health could help it build an even stronger position.
Freshpet, meanwhile, has moved further along the cycle, into the absorb stage. It pioneered fresh dog food, but today trails The Farmer’s Dog on natural food by a wide margin. This suggests much of the memory it earned has already converted into buyers.
Its weaknesses now extend beyond the product itself: it also falls behind on promotion and online availability. To avoid losing its lead to the second mover, Freshpet needs to start rebuilding its memory advantage. That means investing in high-reach campaigns and strong creative work.
Blue Buffalo is the largest of the three, generating more revenue than either rival. Its size also puts it in a strong position to copy the fresh food proposition and capture much of its growth potential. In 2025, it launched its own fresh line, targeting what General Mills describes as a $3 billion segment.
Much of its original advantage in better kibble has been absorbed by now. Yet Blue Buffalo remains strong on product in buyers’ memories, even as fresh food grows and dry food declines. It also has a much stronger position on place, both in buyers’ memories and on actual store shelves. That’s an advantage The Farmer’s Dog cannot easily or quickly replicate.
And the losers of the product fight?
Taste of the Wild’s earned weaknesses across all needs suggests its sales may be declining. One possible explanation is the FDA investigation into grain-free dog food in 2019, after which sales of the brands named in the investigation fell.
It’s also possible that much of Taste of the Wild’s sales comes from outside buyers’ memories, through pet shop recommendations or automatic reorders. This is common for small, fast-growing brands, but would be much harder to sustain for a brand of its size.
Royal Canin also looks unlikely to see significant growth in its current position. Whatever advantage it once had appears to have been absorbed. Its positioning centers on exactly for my dog, a need where brands barely differ. Despite its many breed-specific product lines, it has failed to build a distinct position there.
With weak awareness and advertising, it will struggle to shift buyers’ perceptions. Royal Canin may therefore be a candidate for repositioning.
And what about Purina? As the category leader, it built its lead on complete, affordable food available in every grocery aisle. It still wins on exactly those fronts today: price and supermarket availability.
But no product need in the category is large enough to fuel further growth for a brand of Purina’s size. Its strength on price also keeps it out of the new fight. Across our study, brands that win on low price tend to lose on perceived quality. Purina is a clear example, sitting well below the level its size would predict on natural food. That’s often the trade-off that comes with owning the low-price position.
So does Purina need to respond at all? It has already launched a deep-frozen fresh food line, Purina ONE Fresh Entrées, but under a smaller sub-brand. Whether it can bring its mass production up to human-grade standards while keeping prices affordable is another question. That would be no easy feat.
Ultimately, Purina does not need to win on product. It only needs to lose less ground there, as long as it holds on to its lead in price and availability.
Averaging each brand’s cues within each of the four Ps gives us a snapshot of where each brand stands:
Each US dog food brand has a different 4P profile
Behavio (2026)
Figure 37
The pattern we see in US dog food plays out across many other categories too. Together, these stories help explain the numbers and breakthrough odds from the previous chapters. The challengers did not seem to grow by finding an empty gap or simply looking different. They picked their fight and had the product, organization, and promotion to win it.
The next chapter explains a choice this chapter made without much fanfare: treating price, place, and promotion as part of mental availability. Shouldn’t mental availability be limited to category entry points, with price left out? And shouldn’t physical availability be measured on actual shelves?
Chapter 3
Mental availability includes links across all 4Ps, not just CEPs
Mental availability is the chance that a brand is noticed or thought of in buying situations. It rests on memories that link the brand to the different cues that come up in these situations. The more cues a brand is linked to, and the fresher those links, the better its chance of coming to mind and being bought.
On the page in How Brands Grow where mental availability is first introduced and defined, Byron Sharp describes it as the network structure in buyers’ memories and illustrates it with a bank. The first association on his list is a branch near work, a place association. Three others of the twelve are also about place: a branch on high street, internet banking and can get cash out. Three are about the product: home loans, Visa and my first credit card. Another three are distinctive assets, which fall under promotion: the color, the logo, and the staff uniform (p. 177).
However, in How Brands Grow Part 2, in a chapter written by Jenni Romaniuk, the definition of mental availability narrowed. It became tied to category entry points (CEPs): situations and needs that arise before any brand enters the picture, such as saving for a home or moving to a new city. These are what trigger a search in memory. Almost none of the bank associations from the first book would still qualify. A branch near work belongs to one specific bank, so it cannot trigger a search for any bank.
In this view, only CEPs “get a brand into the race.” Brand attributes linked to product features or price, described as heuristics, baseline category competencies, or reasons to reject a brand, only help buyers decide “which one to buy when there is a mental availability tie.” And if a brand is hard to find, that is a physical availability problem, assessed through store audits, not a question of memory.
In this chapter we show that the original, broader view makes more sense, both in the data and in practice. CEPs are more likely than other attributes to have low movability, where every brand gets the link simply because of its size. Brands also build strong, readily accessible memories around price and place, just as they do around other needs relevant to a buying situation.
Before challenging category entry points, it is fair to recall what a typical brand attribute battery looked like before they came along. How Brands Grow provides an example: trusted, efficient, rapport, relevant, solution, innovative, essential.
How often have you sent a parcel or bought a phone and thought, even subconsciously, “Ah, essential”? Attribute batteries relied on absurdly brand-centric language, as if buyers had enough spare glucose for their brains to conjure up words like “rapport” while standing at the shelf.
Turning the battery around to focus on buyers and their real needs was absolutely the right correction. To whiten my teeth or to get through the afternoon slump can be genuine needs that lead people to look for a product or brand to meet them.
The second key idea is that a need can simply be an occasion: a Friday night in, a kid’s birthday party, when friends drop by unannounced. There need not be a reason to believe or a goal behind it. A brand can be linked to a situation in life, and that alone can matter.
Romaniuk’s 7W framework (when, while, with what, with whom, where, why, how) is a useful way to build a long list of situations in which your brand could be the answer.
But Romaniuk goes further, drawing a distinction between CEPs and other attributes. Only CEPs count toward mental availability. Other associations are classified as “baseline category competencies” or reasons to reject a brand. This is where the framework starts to get a little complicated, unclear, and shaky.
3.2 Only the wording separates a CEP from an attribute
For Romaniuk, reliable and good quality are “baseline category competencies,” not CEPs, because they cannot exist independently of a brand or product. Nobody needs good quality in the abstract. They need something to be good quality. A buyer does not start the day thinking, “I need a good-quality coffee brand.” They start by needing a morning energy boost. No brand is required to define that need: coffee might provide it, but so might exercise. This is where memory retrieval begins. The argument, then, is that only CEPs count toward mental availability.
It sounds plausible, but the distinction between the two mostly comes down to wording.
A simple copywriting change can move an attribute into CEP territory. Reliable does not qualify because reliability needs something, such as an outdoor-wear brand, to belong to. Rephrased as to stay dry when the weather turns, it suddenly fits the Why type of CEPs. That kind of rewording can be useful. But nobody knows exactly how memories are worded or stored in our heads, and they are most likely stored as neither version. Both are highly relevant when buying outdoor gear, far more so than essential. Reliable carries much the same meaning with less effort for the brain to decode. That is hardly a reason to exclude it from mental availability.
3.3 CEP-like needs more often have low movability
Romaniuk recommends that CEPs make up most of a brand tracker’s attributes, 60–70%, because they are what make up mental availability. The remaining attributes, baseline category competencies such as reliable or good quality, are there to check that the brand keeps up, “to ensure the brand does not underperform.” This is presented as a rule of thumb, without supporting evidence.
The data tell a different story. Many textbook CEPs have low movability: every brand gets linked to them in proportion to its size, just as it does with a baseline competency. Take coffee, for example.
A morning energy boost is as clear a CEP as any. Yet in the UK and the Netherlands, it is the least movable product need on the list: brands sit just 1.8 and 2.0 points from their expected positions. Every brand gets the link its size predicts, and none gets more. In a tracker, this is exactly the kind of cue that only checks whether a brand is keeping up.
Premium quality, which does not qualify as a CEP, is the most movable product need in Dutch coffee, with brands sitting 6.7 points from their expected lines. In Germany, the two most movable needs are environmentally friendly (7.4) and gentle on the stomach (6.8), neither of which qualifies as a CEP either. These are the needs where coffee brands differ, yet a tracker following the rule of thumb would only be checking that brands keep up.
Coffee is not an exception. The line between a CEP and an attribute is blurry, so we sorted all 397 product needs using the distinction most often applied in practice. On one side are needs, goals, feelings, and occasions that exist independently of any brand: a pick-me-up, to watch sports events, or for an aging dog. On the other are qualities, ingredients, origins, features, and services: premium quality, German origin, expert advice, or high meat content. The CEP-like needs have low movability 40% of the time, compared with 28% for the others. We set aside 33 needs that could go either way. To watch on multiple devices in streaming, for example, is a situation the buyer is in, on the train or in front of the TV, but also a feature of the app. Counted on either side, the result barely moves: 40% against 28–30%. Meanwhile, the needs that a CEP list would demote are almost twice as likely to be movable: 18% versus 10%. The pattern holds across all eight categories. In coffee and colas, not a single CEP-like need is movable.
CEP-like needs more often have low movability
Behavio (2026)
Figure 38
None of this makes occasions useless. Great for evening relaxation in Dutch streaming is a genuine occasion. It matters to 85% of buyers, and it is a competitive battleground: brands sit 6 to 8 points from their expected positions, and five of the six claim it less than its prevalence would suggest. Netflix sits 9.7 points above its line, Film1, with 6% of buyers, sits 8.3 points above, and Viaplay sits 10.8 points below. An occasion like this belongs on every tracker’s long list. But it earns its place the same way premium quality or expert advice does: it matters, and brands can compete over it.
And all of this was product. Price and place can be just as movable: in some markets and categories, low price and easy to buy in-store are more movable than almost any product need in the study. Should they be part of mental availability too?
3.4 Price and place memories are retrieved as fast as CEPs
Technically, price and place could serve as CEPs: when money is tight, or without having to go far. In the Ehrenberg-Bass model, they never do. In every example, they are classified outside mental availability, as heuristics, competencies, or physical availability. They come into play only after the CEPs have done the retrieval, helping decide “which one to buy when there is a mental availability tie.”
Nobody has found evidence of this sequence in the brain. Neither cognitive science nor neuroscience shows that brand memories are retrieved in stages by type:5 first a CEP, then, once a few brands come to mind, price and quality. As far as we know, memories are not sorted by type. They most likely activate in parallel, all at once.
Our own data points the same way. Every response to the 4P cues came within 3 seconds, usually much faster. We discarded the few slower responses. Even so, brands still own strong positions on price and place. These are fast memories, not the result of deliberation.
So this line does not hold either: “you still need the Mental Availability to be in the race, even when the heuristic helps make the choice.”
The first time you find yourself broke, there is no established memory linking an occasion like when I am broke to a brand. You are simply broke, and several things activate at once, including the type of product you want and the need to have it cheap. As a result, cheaper brands come to mind. A price or a place memory can be exactly what puts a brand in the race.
The brain does work in two steps, just not by type of memory. First, the hippocampus brings back whatever is linked to the situation, so it could be a need, a price, a place, all at once. Then the ventromedial prefrontal cortex puts everything that came back on one scale, and the result is the feeling I want this one. Neither step looks at CEPs first and price later (Shadlen & Shohamy, 2016; Bartra, McGuire & Kable, 2013). ↩
3.5 Price and place in memory differ from actual price and distribution
The usual reply is that place and price are not memories at all. Place is physical availability, price is what appears on the label, and both can be checked through store audits and price lists. True, but none of this argues against price and place memories being crucial to mental availability. A shop opens twenty meters up the street. If nobody knows it is there, your distribution has improved, but your sales have not. A brand can cut its price and still be remembered as expensive.
The gap is the point, not a flaw. Marketers already accept this for promotion. An ad can reach a million screens, yet very few people may notice or remember it. Only those who remember it can buy because of it. The same gap exists across the other three Ps. Audits and channel data are essential for many tactical and operational decisions. But if you have only one number to watch, the Ps in mind are the better choice: a brand is rarely seen as easy to buy unless it is, while it can sit on every shelf and still go unnoticed.
3.6 The 4Ps map to what marketers control, so each gap points to a team that can act
The marketing 4Ps, product, price, place, and promotion, are the four main levers marketers can pull. They were never defined by what matters to buyers, but by what a manager can control. They divide up the manager’s job, not the buyer’s mind.
That is also the standard criticism: the 4Ps are too manager-centric, built around what marketers control rather than what people want. This is probably why they never became a framework for sorting attributes in brand measurement, a field that sees itself as the buyer’s advocate. Instead, what gets measured has followed each era’s view of the customer’s mind: functional benefits in the rational era, brand personality in the era that followed, and CEPs today.
We interpret the 4Ps through the lens Bob Lauterborn proposed, as the customer’s 4Cs. Seen from the buyer’s perspective, they cover nearly everything that shapes a choice, while most batteries cover only part of it:
The 4Ps from the buyer’s side: the 4Cs and what buyers remember
P
C
What the buyer remembers
Product
Consumer needs
It does what I need: an occasion, a function, a feeling, or a signal to others
Price
Cost
It’s worth it
Place
Convenience
It’s easy to get
Promotion
Communication
I know it, I recognize its look and its ads
Behavio (2026)
Figure 39
Promotion is the one people are least willing to admit influences what they buy. Yet there is plenty of evidence that it does: familiarity builds trust and makes the choice feel safer.
Of course, buyers’ memories are unlikely to be sorted into these four boxes in the brain. But companies organize their work, and often their teams, around the 4Ps: product, pricing, distribution, and marketing. Most marketing teams no longer control the other three, but they are well placed to show how all four work together in the minds of current and future buyers. It is a perspective the board rarely gets from anyone else.
Measuring the other Ps is also the only way to properly interpret marketing’s own results.
3.7 Promotion can only be judged alongside product, price, and place
Most marketers have sat through this meeting. The campaign tested well. Awareness is up, and brand scores are up. Sales are not. Then someone asks what marketing did with the money.
There are two possible explanations, and they call for opposite actions. Either something else is holding the brand back, whether the product, the price, or how easy it is to buy. In that case, more advertising will not fix the problem. Or nothing else is holding it back, and the memory is simply being built before the purchases follow. In that case, the campaign needs more time. On a dashboard that measures only promotion, these two situations look identical.
Measured across all four Ps, these situations look very different. Three challengers in the German car market show how differently a brand can be held back. Tesla sits 9 points above its size on promotion, but price holds it back, worst of all on good value for money. Hyundai faces the opposite problem: it performs far above its size on price but is weakest on promotion, with both its look and its advertising below what its size would suggest. BYD is strong on price, too, but held back by place: servicing, showroom purchases, and test drives. For each brand, the biggest gap sits with a different team.
Three challengers, each held back by a different P
Behavio (2026)
Figure 40 · Points above or below what each brand’s size predicts, German cars.
The reverse happens, too: promotion can carry a brand that sits below its size on other Ps, whether by design or not. Coca-Cola in Germany, the Apple Store in the US, and Mercedes in Germany all sit well below their size on price, and well above it on promotion. But each is carried by something different. Coca-Cola is recalled unprompted 13 points more than its size predicts, and its advertising stands out. The Apple Store is carried by its look, its brand elements 11 points above its size, while it is recalled barely more than its size predicts. Mercedes is carried by its advertising, which sits 11 points above its size, while its awareness and recall are no higher than its size predicts. For all three, being below their size on price is part of their position. Mercedes, for example, sits 23 points above its size on status and 22 points below it on low price. We explore the nuances of interpreting these profiles in Part Two.
Three brands carried by promotion despite weak price scores
Behavio (2026)
Figure 41 · Points above or below what each brand’s size predicts.
None of these conclusions is possible from a promotion dashboard alone, or from the usual price and distribution data. Marketers usually respond that they already know their price and distribution. But a store count does not tell you how many buyers find the brand easy to buy, and a price list does not tell you how many consider it good value. Only when all four Ps are measured in the same units and against the same size line can promotion be assessed alongside the other three. Then even a flat quarter after a campaign can be read: the ads had no effect, or they held the line while the product, price, or place got worse.
Even if most marketers control only promotion, measuring the other three Ps using the same cues, protocol, and scale lets them make better decisions about how to use it.
3.8 The 4Ps plus ease of retrieval predict brand size in five markets
A careful reader may have noticed two unfamiliar cues in the last two figures: known and unprompted recall, both measured relative to brand size. Unlike the other cues, which measure prompted links between a need and a brand, these two measure prompted awareness and unprompted recall, each compared with what the brand’s size predicts. We added them after investigating whether the 4Ps really explain a brand’s sales.
That check is harder than it sounds. Brand size drives around 90% of every brand metric, so everything correlates with sales. Even a low-movability cue can track sales at 0.99. Liking explains 95% of the differences in sales between brands. Most of that is liking following sales, but what explains the rest? Most likely, something in the concrete 4P cues. Liking rolls all of it into a single number, leaving nobody any wiser about which factors matter. And “be more liked” is not something a brand can act on.
If the Mental 4Ps track sales just as well, that changes the picture. Every detail is captured in the number: the positions a brand owns, how movable they are, and their occupancy. We averaged the cues within each of the four Ps, then averaged the four scores into one. All scores were standardized within each category. Together, the Mental 4Ps explain 92% of the differences in sales between brands, nearly as much as liking.
Could anything improve the result? We tested everything else in the data, including liking. It all moved with the 4Ps and added no new information, with one exception: unprompted recall. Among mid-sized brands, recall behaves differently from the 4Ps. Whether a brand sits at 10% of buyers or 30% can depend on having more 4P links, or simply on being easier to recall. So we added unprompted recall, adjusted for brand size, to the promotion box. Once past buying is accounted for, what remains is ease of retrieval: how readily the brand comes to mind, which promotion can largely influence. Throughout this paper, ease of retrieval is the concept and unprompted recall, adjusted for size, is how we measure it. Adding it improves the result by three percentage points. More concretely, it brings 11 more brands in every 100 to within 5 points of their actual size.
Together, the 4Ps and ease of retrieval explain 95% of the differences in sales between brands, matching liking. But unlike liking, we know what is inside.
The 4Ps explain sales almost as well as liking, and brands can act on them
Share of sales differences explained
Can a brand act on it?
Liking
95%
No
4Ps
92%
Yes
Unprompted recall
87%
Partly
4Ps + unprompted recall
95%
Yes
Behavio (2026)
Figure 42
This isn’t tailored to one country. We developed the model in the US, froze it, and used it unchanged to predict brand sizes in Czechia, Germany, the Netherlands, and the UK. It explained 93% to 96% of the differences in each market, as it did at home.
The US model predicts brand size in four other markets, unchanged
Behavio (2026)
Figure 43
All of this rests on one step we have so far taken on trust: separating what a brand owns from what its size gives it. The next chapter shows how we account for size, and why most trackers cannot.
Chapter 4
Why standard trackers miss earned positions, and how we measured them
Roughly 90% of any brand metric is the brand’s size. Only the remaining 10% tells you something about the brand itself. This changes how every metric in a tracker should be interpreted, not just attribute scores. In our data, awareness explains 80% of the differences in sales between brands, unprompted recall 87%, consideration 93%, and liking 95%. Loyalty, perceived uniqueness, promoter score, and many other well-known metrics follow the same pattern. Taken at face value, they mostly measure buyer numbers in disguise. Until you separate the effect of size, you cannot tell what else these metrics reveal about a brand.
But accounting for size properly is harder than it might seem. We tried to keep it simple, but found that the simple approaches were misleading. What held up was a specific curve for each cue, fitted across all categories and markets at once.
4.1 Separating earned from size-granted answers depends on a well-drawn size line
An earned memory is a deviation: how far a brand sits above or below what a brand of its size would typically score. So everything depends on getting one thing right: the expected score that brand size alone would predict. Drawing that line is a statistical task. The full method, including the reasoning and equations, is in the methodological appendix. Here are the principles behind it and how we arrived at them.
Look at these two needs, where no brand clearly owns a position. But the effect of size is very different for each cue. Great taste climbs from 6% for the smallest brand to 75%. Natural ingredients tops out at 48%, even for Coca-Cola, which reaches nearly nine in ten Dutch cola buyers. In both cases, the need is almost fully size-driven. But more people feel great taste is typical of colas than feel natural ingredients are.
Size grants some cues far more than others
Behavio (2026)
Figure 44
About 90% of the differences between scores is size-granted, but not all of it comes from size alone. 76 points come from brand size. Another 14 come from the need, because how much size gives a brand depends on how typical the need is for the category. So every cue, in every category and market, needs its own curve. A tracker measuring 20 attributes needs 20 separate curves to calculate each brand’s deviations correctly.
There is no shortcut. Any method that skips this step will invent strengths and weaknesses, sending brands down paths they cannot win. Mental advantage, the most widely used size adjustment in brand tracking, can misjudge a brand’s true position by up to 15 points. The next subchapter explains why.
So what is the best way to draw the curve? Not by deciding its shape in advance. We tested different shapes and kept the one that predicted scores most accurately. The test is simple. Hide one brand’s score, draw the curve using all the other data, and ask it to predict the hidden score. The difference between the prediction and the actual score is the error. If you repeat this for every score in the study, the average error shows how well the curve captures what brand size alone would predict. We tested nine shapes. The best missed by 5.1 points on average. Without any size adjustment, the average error was 17.7 points.
The model is hierarchical, meaning each curve can also draw on information from the others when needed. Many trackers have relatively few brands to work with. Our study includes up to 12 brands per category, but usually just six. A curve drawn through six points can swing sharply when one point moves. When the six brands provide little evidence about the curve’s shape, the model draws on how the same type of cue behaves across the other 39 category-market combinations. When the six brands show a clear pattern, the curve gives their data more weight. For the smallest brand in each category, this reduced the average prediction error from 5.0 to 3.7 points.
Winning a comparison is not enough, so we ran many tests designed to find where the method might fail. For example, we drew 20 new smaller samples of 1,000 people each. A brand’s score varied by about 1.2 points between samples. Or we reduced the questionnaire to 12, 8, and 6 cues. The results matched those from the full questionnaire with correlations of 0.99 or higher. Full lists of test is the the appendix.
The method is reliable enough for us to confidently treat deviations greater than 3 points as earned memories.
4.2 Mental advantage judges a brand against itself, not against its size
The most widely used size adjustment in brand measurement is a multiplicative model, described in Better Brand Health by Jenni Romaniuk and called mental advantage. In a table, its results look just like ours: +8 here, −4 there.
It was designed as a messaging check within the “rotate the mainstream needs” playbook. For that purpose, it can work, with some caveats we’ll come to below.
Its defining feature is that all the scores sum to zero. If you add up a brand’s advantages and disadvantages, they cancel each other out. This changes the question the model answers. It does not ask, “Mirror, mirror on the wall, who is the fairest of them all?” It asks, “Which is my fairest feature?” That answer can be useful. It shows which features are relatively strongest and weakest for a brand. But your fairest feature might still be plainer than the plainest feature of the fairest brand in the land. Mental advantage will never tell you that.
A brand that is strong across the board sees its ordinary positions as weaknesses. In the Netherlands, Coca-Cola scores exactly where its size would predict on I can afford it regularly, a cue where no brand stands out. Yet mental advantage labels this a 9.6-point disadvantage. Netflix scores 5 points above what its size predicts on easy to buy online, but mental advantage calls it a 9-point weakness.
Neither brand has anything to fix here. Both are simply so strong on other cues that a model forced to sum to zero has to push some scores below the line.
The reverse happens, too. A brand that is weak overall mistakes a weakness for a strength. Purina, the leader in US dog food, falls short of its size on 14 of its 20 cues, so mental advantage expects less from it. On to experience closeness, it reports a small advantage of +1 point. But a brand of Purina’s size would typically score 54 on this cue. Purina scores 48, 6 points below where its size would predict.
The chart shows how mental advantage’s expected values jump up and down from brand to brand. That is because each brand’s expected score comes from its own total links, split across cues the way the whole category splits them, not from its size in the market. Mental advantage does not isolate what a brand has built beyond its size. It adjusts a brand for its size and its other strengths at once, and cannot tell the two apart.
Mental advantage and the size line judge Netflix in opposite directions
Behavio (2026)
Figure 45 · Easy to buy online, Dutch streaming.
Summing to zero has two more costs. First, mental advantage cannot tell you whether a brand is strong overall. In our study, 33 brands score clearly above what their size would predict across their cues. Mental advantage identifies none of them, because every brand’s scores must sum to zero.
Second, whatever you gain on one cue, you lose on the others. If a campaign lifts one cue by 10 points, mental advantage shows a gain of about 8 points on that cue. It then subtracts those 8 points from your other cues, taking a little from each, even though buyers’ perceptions of you on those cues have not changed.
Across our data, mental advantage points in the wrong direction 240 times. It labels 141 genuine strengths as weaknesses and 99 genuine weaknesses as strengths. That is 10% of all earned positions in our data.
4.3 Random speeded pairs reduce the biases of lists and scales
Most brand trackers use one of two methods. Agreement scales show a brand followed by a list of attributes to rate. Pick-any lists show a cue followed by a list of brands to choose from. We used a third method: random, speeded pairs. Respondents see dozens of pairs, one at a time, with a short cue on the left and a brand logo on the right. They answer yes or no. The pairs appear in random order, and any response taking longer than 3 seconds is discarded. We believe this makes a substantial difference when measuring earned positions precisely, especially for small and mid-sized brands.
Three ways to ask the same question
Behavio (2026)
Figure 46
Why go to the trouble? Every list creates a context, and context introduces bias. A brand is judged alongside the names around it, and a cue is judged against the cues that came before it. The answer starts to reflect the screen as much as the memory itself. Many mechanisms can introduce this bias, and they are likely to affect small brands more than large ones. The size curve cannot correct for a bias that does not follow brand size.
Biases of lists and scales, and how random speeded pairs correct them
Bias
Where it occurs
Effect
Why it happens
With random speeded pairs
Skimming. Respondents tick the two or three brands they know and move on, more so as the survey gets longer
Pick-any lists
Understates small brands
A real link to a small brand is recorded as “no” because the respondent never reached it
Removed. Brands are shown one at a time, so every pair gets its own answer
One answer per need. A list leads some respondents to pick only the single best brand for each need
Pick-any lists
Overstates the leader and understates other brands on the leader’s typical needs
The leader collects the ticks; other brands linked to the need get none
Removed. No competing brand names appear on screen
Forced opinion. A scale asks about every brand, including ones the respondent does not know
Agreement scales
Blurs small brands and creates positions that do not exist
“No memory” and “weak memory” both end up in the middle of the scale
Removed. Answers are yes or no, with no middle option, and “no” is always acceptable
Deliberation. “Is Brand X…?” questions give respondents time to think
Agreement scales
Replaces memory with stereotypes
Respondents reason (“big brands must have range,” “premium must be expensive”) instead of recalling
Reduced. The cue is shown first, and answers slower than 3 seconds are discarded
List order. Brands are often listed in a fixed order, sometimes by size
Pick-any lists and agreement scales
Understates brands listed last, usually small ones
Ticks depend on a brand’s position on screen, not on what respondents remember
Removed. Pairs appear in random order
Behavio (2026)
Figure 47
Random pairs also solve a problem every tracker owner knows. In scales and lists, answers influence one another. If you change the questionnaire between two waves, the data shift even when nothing has changed in the market. With random pairs, each answer stands alone. You can add or remove a brand or cue without changing anyone else’s answers. When we shortened the questionnaire to 12, 8, and 6 cues, the results for the remaining cues matched those from the full version with correlations of 0.99 or higher. This independence also made the experiment in Section 2.8 possible: hiding a brand and asking the model where it should fight. It also allows trackers to maintain a long-term time series even as the brands and cues they measure change.
Chapter 5
Conclusions and next steps
Many influential ideas in marketing science rest on patterns observed across brands, often in selected case studies rather than whole categories, and rarely checked on data the analysis has not seen. This study measures every pattern across whole categories in five markets, takes each brand’s size out need by need, and confirms the key results on brands and markets left out of the analysis. The evidence strongly supports all six main claims.
The first claim is methodological: brand image only makes sense relative to brand size, and every need needs its own size expectation, because each need rewards size differently.
The second describes differentiation: 90% of what people say about brands can be explained by size, yet once size is taken out, most brands hold clear strengths and weaknesses of their own.
The third concerns where differentiation happens. Occupancy, prevalence, and movability all shift the odds. The new one is movability: on some needs brands consistently sit far from their size, on others they do not. Movability is measured on a brand’s competitors, never on the brand itself. The effect also holds out of sample: with each brand set aside, the need where competitors differed more was the one where the brand broke through in 62 of 100 pairs, against about 50 by chance. In all five hidden-market tests, the same order of the three questions came out on top for mid-sized brands.
The fourth is that category entry points have no special status among brand memories. Memories of price, place, and promotion come back just as fast, and CEP-like needs are more often low in movability than other product needs (40% vs 28%). The result holds whichever way the 33 borderline needs are counted.
The fifth is that differentiation can turn into size as a brand grows. An earned strength helps a brand win buyers; as the brand grows, the strength becomes part of what its size grants it. That is why a snapshot study finds differentiation “shockingly low”: 90% of associations reflect size even where differentiation drove the growth that created that size. As an explanation, it fits the data. How often this happens, and how fast movable needs settle, is worth measuring over time.
The sixth is that building memories on the needs with the highest breakthrough potential grows penetration more efficiently, against the claim that differentiation hardly matters and any message works about as well. The data points clearly one way. Small and mid-sized brands hold earned strengths 2.5 times as often on high-movability needs as on low-movability ones. Big brands lose ground on those needs 2.6 times as often as they gain it, and lose 3.7 times as often on niche needs as on mainstream ones. Differentiated brands turn roughly 17% more of their awareness into buyers, and only 2 of 246 brands came close to growing on fame and distinctiveness alone.
One level of proof for the last two claims remains: a longitudinal study showing that gains in specific earned memories predict penetration growth, after controlling for other factors. Such studies are rare in marketing science. They need years of consistent measurement and very large samples, because only a small share of brands grow in any given year, and even the largest tracking databases seldom measure the same needs consistently enough. We are working on a way to make this test affordable.
Such a study would add detail on when and how earned memories turn into buyers. It is very unlikely to overturn the patterns here. For example, if challengers broke through on low-movability needs as often as on others, the snapshot would already show it.
Reference
Glossary
Category buyers
People who have bought in the category in the past year, or a car in the past 10 years, screened from a representative sample of each country. Every share in this paper is a share of category buyers.
Buyers (brand buyers) and non-buyers
Buyers: category buyers who have bought the brand. Non-buyers: category buyers who have not. Every link is measured in both groups.
The share of category buyers who have bought the brand in the past year, or in the past 10 years for cars.
Small, mid-sized, and big brands
Bought by under 10%, by 10–29%, or by 30% or more of category buyers.
Mental 4Ps
Mental availability across all four Ps: how likely a brand is to come to mind for its product, price, place, and promotion. All four are measured the same way (as random pairs) and all read against the brand’s size.
Need (cue)
Anything a brand can be linked to in memory. The method chapter calls each one a cue. We measured 775 of them, across 8 categories in 5 countries, sorted by the 4Ps:
Product needs, of four types: functional (what the product does, such as great taste in cola), occasions (when it is used, such as a Friday night in), emotional (how it makes buyers feel, such as feeling secure in insurance), and symbolic (what it says about the buyer to others, such as a sense of status in cars or German origin).
Price, place, and promotion: what the brand costs, where to buy it, and its advertising.
Category entry point (CEP)
A different cut across the same product needs, not a fifth type. A situation that makes buyers think of a category before any brand comes to mind, such as a morning energy boost in coffee. Jenni Romaniuk of the Ehrenberg-Bass Institute sorts CEPs by seven Ws: why, when, where, while, with whom, with what, and how buyers feel. In this paper, a CEP-like need is any product need worded so that it exists without a brand: an occasion, a goal, or a feeling, such as a pick-me-up. Qualities and features that need a brand to belong to, such as premium quality, are not taken as CEP-like, even though often only the wording separates the two.
Random speeded pairs
How every link is measured: respondents see one need and one brand logo at a time, in random order, and answer yes or no. Answers slower than 3 seconds are dropped, so only links that come to mind fast count. No list of brands or needs is ever on screen, so a brand is never judged next to its rivals. This avoids the biases a list creates, and needs or brands can be added or dropped without moving anyone else’s results.
Total association
The share of category buyers who link a brand to a need. 75% of American cola buyers link Coca-Cola to great taste.
Size curve
The line that shows what a brand with a given share of buyers typically scores on one need. It is fitted separately for every need in every category market, because size predicts some needs more steeply than others.
Size-granted association
The part of the total association that comes with size: what a typical brand with that many buyers scores on that need, read off the size curve. All of Coca-Cola’s 75% on great taste is size-granted.
Earned association
The total association minus the size-granted part, in points. Within 3 points either way, size explains it. Beyond 3 points, the association is earned: an earned strength above the curve, an earned weakness below. A brand can earn it through anything that sets it apart beyond its size: the product, its price, where it is sold, its advertising, or simply its history. 46% of Dutch streaming buyers link Viaplay to watching sports events. 20 points of that are size-granted. The other 26 are earned: a +26 earned strength.
Movability (high, medium, low)
Whether brands already differ on a need. High: the brand’s competitors sit on average 6 points or more above or below their size curve. Low: less than 3 points, so every competitor’s link is size-granted. Medium: in between. Status in American cars has high movability: Cadillac sits 22 points above its curve, Toyota 17 below. Great taste in American colas has low movability.
Occupancy (low, medium, high)
Whether competitors already claim a need as much as its prevalence suggests. Low: buyers care about the need more than brands are linked to it. High: brands are linked to it more. Measured for each brand across its product needs and split into thirds. Product needs only.
Prevalence (high, medium, low)
How many category buyers say a need matters. High: above 80%. Medium: 60–80%. Low: below 60%. The bands follow Behavio’s brand tracking benchmarks. 89% of Dutch car buyers say a dependable car matters, so its prevalence is high. Product needs only.
Breakthrough potential
Where a product need ranks for one brand, from #1 to #27, once movability, occupancy, and prevalence are sorted in the order the brand’s size calls for. Small and mid-sized brands: movability first, then occupancy, then prevalence, with mid-sized brands setting low-prevalence needs aside first. Big brands: prevalence first, then occupancy, then movability. Potential #1 is the best available need.
About
About the authors
Vojtech Prokes and Jiri Boudal are the co-founders of Behavio, a research technology company.
They studied sociology and market research together before pursuing separate careers in marketing and research. In 2015, they reunited on a glacier alongside two former classmates, one completing a PhD in behavioral economics, the other in biostatistics. Somewhere along the climb, the four decided to start a company that would pioneer new approaches to brand and advertising research, combining behavioral science with non-declarative measurement.
Their ambition was to turn that science into clear, actionable next steps for marketers, not another 100-slide report.
Behavio now serves 600 clients and measures brands in over 40 markets.
Clients include Decathlon, IKEA, and dozens of the kind of brands this paper is about: underdogs that became the biggest in their categories across the continent, such as Bunq, Notino, and GymBeam.
Many people at Behavio contributed to this study.
Appendix
Methodological appendix
A. Data and sample
The study covers 246 brands in 8 categories and 5 markets: the US, the UK, Germany, the Netherlands, and Czechia. Each category in each market is one cell, 40 in all, with about 6 brands each. In every cell, 1,500 nationally representative respondents were screened for category buyers, 60,000 interviews in total, collected from June to August 2026.
Brand size is penetration: the share of category buyers who bought the brand in the past year, or in the past 10 years for cars. Across the study it runs from 1% to 89%.
Each cell has 18 to 20 needs across the 4Ps, and every brand was scored on every need: 4,758 brand–need scores. With relative awareness and relative unprompted recall added for each of the 246 brands, the study holds 5,250 measurements. Product needs alone give 2,442 brand–need pairs, 484 for small brands, 902 for mid-sized, and 1,056 for big. These 2,442 pairs are the base of every breakthrough table in Appendix D.
We are open to sharing the data for research and scientific purposes.
B. How the size curve was chosen
The model. A hierarchical (mixed-effects) logistic regression that models each association score as a function of the logarithm of brand penetration, defined as its share of category buyers. The shared component is estimated once using restricted maximum likelihood (REML), based on all 4,758 scores across 40 category-market cells.
The equation. For each cue, the model estimates the odds of a brand being linked to it:
Here μp is the baseline level for each of the 4Ps when a brand has 20% of category buyers. This baseline is shared across the study. β = 1.18 describes how quickly scores rise with brand size: doubling a brand’s buyers multiplies its odds of being linked to a cue by about 2.3. u(category) allows each category-market cell to start at a higher or lower level and rise faster or slower than the study-wide average. v(cue) allows each cue to differ in the same way within its category.
Why hierarchical. The category and cue effects, u and v, are not estimated independently. Each is pulled toward zero depending on how much its own data, usually from just six brands, can be trusted. Roughly, the weight given to a local estimate is: w = τ² / (τ² + error²). Here, τ² measures how much categories or cues genuinely differ, while error² measures the uncertainty in the local estimate. With few brands or noisy scores, w is low, so the curve relies more on the rest of the study. The slope also depends on how widely the brands vary in size. When their sizes are spread out, the curve can follow their pattern. When their sizes are clustered together, it borrows more heavily from the study-wide slope.
What is estimated where. μp, β, and the variances are estimated once for the whole study and are not re-estimated for each new category. For each new measurement, only u and v are estimated, using the data from that category’s own brands.
What is left out. The model deliberately excludes a brand-level random effect. This keeps a brand’s overall strength in its deviations rather than averaging it away. The question remains: “Does this brand score above what its size would predict?” rather than “Does it score above its own average?”
Awareness and unprompted recall are not associations and get their own curve: one slope for each, estimated once across all categories, and a level set within the category.
Chapter 4 gives the model and its equation. The tables below show what it was tested against.
Four ways to define a deviation, applied to the same 4,758 scores:
B1. Four ways to define a deviation
Route
Spread of deviations (SD, points)
Correlation with brand size
Difference from the category average
17.80
0.845
Index against the leader
8.89
−0.167
Multiplicative model (row × column ÷ total)
5.14
0.000
Curve through penetration, ours
5.66
−0.040
The category average leaves size in: its deviations correlate 0.845 with brand size. The index against the leader flatters small brands: across all brands, the average deviation comes out at +6.2 instead of zero. The multiplicative model, used by Romaniuk and Sharp among others, lands close to ours (correlation 0.82), but it takes brand size from the brand’s own image scores, so every brand’s average deviation is zero by construction. Of the 33 brands that sit more than 3 points above their curve on average in our model, it flags none.
RTL+, bought by 22% of German streaming buyers, is linked to wide selection of content by 38%. The category average puts it 10.3 points below, the index against Netflix, the leader, 10.6 points above, and the size curve 1.1 points below.
Curve shapes. Each candidate was scored the same way: one score held out, the curve fitted on the rest, the held-out score predicted. The error is the average miss in points.
B2. Curve shapes compared on held-out error
Curve
Error, points
Against the chosen one
Hierarchical logit on log penetration, no brand halo (chosen)
5.06
–
The same, with a brand halo
4.41
−13.0%
Binomial logit on log penetration, one need at a time
5.51
+8.8%
Weibull (binomial cloglog on log penetration)
5.70
+12.6%
Gompertz (binomial loglog on log penetration)
5.79
+14.4%
Least squares on penetration0.35
5.90
+16.5%
Least squares on a pooled saturating shape
5.96
+17.6%
Least squares on penetration0.5
5.96
+17.7%
Binomial logit on penetration0.5
6.45
+27.3%
Category average, no size adjustment
17.66
+248.8%
The halo version wins this test and is still left out. With one score held out, the halo learns the brand from its other scores. With the whole brand held out, the gap nearly closes: 5.25 with the halo, 5.34 without. A halo would also change the question from “above what its size predicts” to “above its own average,” so a brand weak on every need would come out normal.
The logarithm was not imposed. Left free in the Box-Cox family, where an exponent of 0 is exactly the logarithm, the exponent lands at 0.012.
Two results sit on thresholds. On fresh samples, a pair changes deviation band in 11.3% of cases and movability band in 13.8%, almost always right at a cut-off: 73% of the movability changes lie within half a point of 3 or 6. The deviation itself barely moves. The bands are cuts through a continuous number, so a pair right at a cut-off can be read either way.
The curve is evidence only between the smallest and the largest brand measured in a cell.
C. How movability, occupancy, and prevalence are computed
Earned association. For brand b and need n: earned = observed − expected, where expected is the score the size curve gives a brand with b’s share of category buyers. This curve is fitted on all brands in the cell. A deviation within ±3 points counts as noise.
All three are computed on product needs, from a brand’s competitors, with the brand left out of the curve. A dimension never sees the score it is meant to explain.
Movability of need n for brand b is the average, over the other brands j in the cell, of |observedj − expectedj|, in points, with every expected value taken from a curve fitted without brand b. Low: under 3. Medium: 3 to under 6. High: 6 or more. It has no fitted parameter.
C1. Movability bands: pairs beyond ±6 vs chance
Movability
Pairs
Beyond ±6
By chance
Low
879
26.3%
28.7%
Medium
1,218
36.4%
29.0%
High
345
53.6%
32.7%
Beyond ±6 is measured with the brand left out of its own line. Chance comes from 20 datasets regenerated with binomial noise around the fitted curves.
Occupancy of need n for brand b sets how strongly the need is linked to brands against how many buyers care about it, in four steps:
1. Saturation s = the score that the curve fitted without b gives a brand with 20% of category buyers.
2. Across b’s product needs, fit a least-squares line:
logit(s) = a + c · prevalence
3. The gap is how far saturation falls short of what the need’s prevalence leads you to expect:
gap = (a + c · prevalence) − logit(s)
4. Within the brand, needs are ranked by gap and split into thirds: the top third is low occupancy, the middle third medium, the bottom third high occupancy.
The 20% reference is close to the median brand (25%) and inside the range of measured brands in 37 of 40 cells. At 10% or 30%, needs rank almost identically (rank agreement 0.968 and 0.981).
Prevalence is the share of category buyers who say a need matters when they choose. High: above 80%. Medium: 60–80%. Low: below 60%. The cut-offs are terciles of Behavio’s brand tracking benchmarks, not of this study, where 42% of product needs fall below 60%. We use prevalence for product needs only. Buyers rated price, place, and promotion items as well, but we leave those ratings out. Most buyers say price matters to them, so a high score there says little about the market. Most say promotion doesn’t, yet many other studies show that it does shape their decisions.
Across all brands, prevalence barely changes how often they break through: 12%, 13%, and 14% of pairs do, from the lowest to the highest third. It changes how often they fall back. Big brands lose on 22.0% of low-prevalence needs and on 5.9% of high-prevalence ones, 3.7 times as often. Mid-sized brands lose 2.1 times as often (13.2% against 6.4%). Prevalence also shows what a breakthrough is worth. Among 150 brands in Czechia, the Netherlands, and the UK, brands whose aware non-buyers link them to high-prevalence needs turn awareness into buying better (r = 0.29, p = 0.001).
The three are independent. Within a brand, the rank correlation of occupancy with prevalence is 0.01, with movability 0.05, and between prevalence and movability −0.15.
Breakthrough potential sorts a brand’s product needs into 27 combinations, 3 bands on each dimension, in the order its size sets. Small brands: movability, then occupancy, then prevalence. Mid-sized brands: the same, with low-prevalence needs moved to the end. Big brands: prevalence, then occupancy, then movability.
Brand size comes from penetration: small under 10%, mid-sized 10–29%, big 30% or more. Each product need gets a band on movability, occupancy, and prevalence (high above 80%, medium 60–80%, low below 60%). Its potential, #1 to #27, is the position of that combination in the order table for the brand’s size.
C2. Breakthrough potential rank for every combination, by brand size
Movability
Occupancy
Prevalence
Small
Mid-sized
Big
High
Low
High
#1
#1
#1
High
Low
Medium
#2
#2
#10
High
Low
Low
#3
#19
#19
High
Medium
High
#4
#3
#4
High
Medium
Medium
#5
#4
#13
High
Medium
Low
#6
#20
#22
High
High
High
#7
#5
#7
High
High
Medium
#8
#6
#16
High
High
Low
#9
#21
#25
Medium
Low
High
#10
#7
#2
Medium
Low
Medium
#11
#8
#11
Medium
Low
Low
#12
#22
#20
Medium
Medium
High
#13
#9
#5
Medium
Medium
Medium
#14
#10
#14
Medium
Medium
Low
#15
#23
#23
Medium
High
High
#16
#11
#8
Medium
High
Medium
#17
#12
#17
Medium
High
Low
#18
#24
#26
Low
Low
High
#19
#13
#3
Low
Low
Medium
#20
#14
#12
Low
Low
Low
#21
#25
#21
Low
Medium
High
#22
#15
#6
Low
Medium
Medium
#23
#16
#15
Low
Medium
Low
#24
#26
#24
Low
High
High
#25
#17
#9
Low
High
Medium
#26
#18
#18
Low
High
Low
#27
#27
#27
D. Breakthrough rates by brand size and need dimension
Base: 2,442 product brand–need pairs. A win is an earned association of +6 points or more; a loss is −6 or less. Each percentage is a share of the pairs in its row, with the number of cases in brackets.
D1. Movability
Brand size · movability
Pairs
Wins
Losses
Wins per loss
Small · high
85
9.4% (8)
4.7% (4)
2.0
Small · medium
268
6.0% (16)
3.7% (10)
1.6
Small · low
131
3.1% (4)
2.3% (3)
1.3
Mid-sized · high
115
27.8% (32)
24.3% (28)
1.1
Mid-sized · medium
440
20.9% (92)
9.5% (42)
2.2
Mid-sized · low
347
10.1% (35)
4.3% (15)
2.3
Big · high
145
13.8% (20)
36.6% (53)
0.4
Big · medium
510
12.5% (64)
12.4% (63)
1.0
Big · low
401
6.5% (26)
10.0% (40)
0.7
D2. Occupancy
Brand size · occupancy
Pairs
Wins
Losses
Wins per loss
Small · low
185
5.9% (11)
2.7% (5)
2.2
Small · medium
152
6.6% (10)
3.9% (6)
1.7
Small · high
147
4.8% (7)
4.1% (6)
1.2
Mid-sized · low
351
19.7% (69)
7.1% (25)
2.8
Mid-sized · medium
279
19.7% (55)
12.2% (34)
1.6
Mid-sized · high
272
12.9% (35)
9.6% (26)
1.3
Big · low
412
9.2% (38)
17.5% (72)
0.5
Big · medium
327
9.2% (30)
14.4% (47)
0.6
Big · high
317
13.2% (42)
11.7% (37)
1.1
D3. Prevalence
Brand size · prevalence
Pairs
Wins
Losses
Wins per loss
Small · high
110
7.3% (8)
4.5% (5)
1.6
Small · medium
181
5.0% (9)
1.1% (2)
–
Small · low
193
5.7% (11)
5.2% (10)
1.1
Mid-sized · high
173
18.5% (32)
6.4% (11)
2.9
Mid-sized · medium
343
17.2% (59)
6.7% (23)
2.6
Mid-sized · low
386
17.6% (68)
13.2% (51)
1.3
Big · high
203
12.8% (26)
5.9% (12)
2.2
Big · medium
412
11.2% (46)
11.4% (47)
1.0
Big · low
441
8.6% (38)
22.0% (97)
0.4
D4. Breakthrough potential
Brand size · potential
Pairs
Wins
Losses
Wins per loss
Small · #1–#9
85
9.4% (8)
4.7% (4)
2.0
Small · #10–#18
268
6.0% (16)
3.7% (10)
1.6
Small · #19–#27
131
3.1% (4)
2.3% (3)
1.3
Mid-sized · #1–#9
150
24.0% (36)
10.0% (15)
2.4
Mid-sized · #10–#18
366
15.0% (55)
5.2% (19)
2.9
Mid-sized · #19–#27
386
17.6% (68)
13.2% (51)
1.3
Big · #1–#9
203
12.8% (26)
5.9% (12)
2.2
Big · #10–#18
412
11.2% (46)
11.4% (47)
1.0
Big · #19–#27
441
8.6% (38)
22.0% (97)
0.4
For small brands, the first sort is movability, so D4 repeats D1. For big brands, it is prevalence, so D4 repeats D3.
A ratio counts as reliable when both sides have 10 or more cases, and as indicative with 5 or more. Below 5, it is not used.
D5. The ratios in the paper, and how many cases carry them
Ratio
Small
Mid-sized
Big
Wins, high vs low movability
3.1x (8 vs 4: not used)
2.8x (32 vs 35: reliable)
2.1x (20 vs 26: reliable)
Losses per win, high movability
–
0.9 (28 vs 32: reliable)
2.6x (53 vs 20: reliable)
Wins, low vs high occupancy
1.2x (11 vs 7: indicative)
1.5x (69 vs 35: reliable)
0.7x (38 vs 42: reliable)
Losses, low vs high prevalence
1.1x (10 vs 5: indicative)
2.1x (51 vs 11: reliable)
3.7x (97 vs 12: reliable)
Wins, potential #1–#9 vs #19–#27
3.1x (8 vs 4: not used)
1.4x (36 vs 68: reliable)
1.5x (26 vs 38: reliable)
Small brands have too few wins to carry a ratio of their own. Pooled with mid-sized brands, high movability gives 20.0% wins against 8.2% on low movability, 2.5 times, on 40 and 39 cases. Adjusted for brand size (Mantel-Haenszel), the ratio is 2.8.
The pair and triple tables (movability × occupancy, movability × prevalence, all three together) are in the data download. Too many of their cells hold fewer than 5 cases to print.
E. Robustness checks: sampling noise and the ±6 threshold
The deviations are not noise. The whole dataset was regenerated 20 times from the fitted curves with nothing but binomial sampling noise:
E1. Deviations in real data vs pure sampling noise
Expected by chance
Observed
Deviations above +5 points
10.9
777
Deviations above +10 points
0.0
208
The observed spread of deviations is 5.66 points; sampling error accounts for 1.21. 95% of the variance is real.
The strict version makes the result stronger. With every brand left out of its own cell’s curve, deviations above +10 rise from 208 to 348. The paper reports the smaller numbers, except in three places that use the strict version, with each brand left out of its own line: the awareness gap in Section 2.1, the breakthrough rates in the movability table in Appendix C, and the hidden-brand test in Section 2.8.
Why ±6. The noise of a single measurement crosses no threshold from 3 points up. At +3, a quarter of all scores would count as wins. At +10, only 4% are left. ±6 is the lowest threshold where wins and losses cluster on needs clearly more than chance, with enough cases left for every combination.
E2. How each threshold trades noise against cases
Threshold
Noise exceeds it
Scores above +t
Needs with 2+ cases: data / chance
±3
0.585%
26.1%
414 / 405 (1.0x)
±4
0.039%
20.6%
297 / 262 (1.1x)
±5
0.001%
16.3%
202 / 161 (1.3x)
±6
0.000%
12.8%
138 / 92 (1.5x)
±8
0.000%
7.4%
51 / 27 (1.9x)
±10
0.000%
4.4%
25 / 8 (3.2x)
Key Findings
Brand size explains 90% of what people say about brands, but the other 10% is where challengers stand out from established players.
##INLINE0## is what lets challengers win: active category battlegrounds where perceptions can outpace brand size.
Priorities reverse with scale, which validates the Ehrenberg-Bass playbook for market leaders: challengers should target high-movability needs, while market leaders should put mainstream needs first.
Growth hides the differentiation that drove it: as a challenger grows, its size starts to explain the same links, so a snapshot study can see a big brand as undifferentiated on the need it grew on.
Mental availability is more than category entry points: memories of product functions, price, place, and promotion come back as fast as CEPs, and many CEPs have low movability, which blocks challengers (40% vs 28% of other needs).
Brand research must take brand size out, otherwise it is only market share in disguise, and it must do so separately for every need: on some, being big lifts a brand’s score a lot; on others, barely at all.
Introduction
Differentiation or distinctiveness? What 246 brands say
Should a brand stand for something different from its rivals to be chosen?
It is one of the most fundamental questions in business and marketing, yet it remains unresolved. Despite years of discussion, we still lack solid evidence and data to settle it.
The debate is far from over. At Cannes Lions in June 2026, two of marketing’s best-known professors, Mark Ritson and Byron Sharp, agreed on many things, but reached no agreement on differentiation.
For decades, marketing textbooks have taught that a brand must stand for something different from its rivals to be chosen, an idea that runs from Reeves’s unique selling proposition through Kotler’s Marketing Management to Ries and Trout’s Positioning. Today, that belief is openly contested.
Ritson defends a more nuanced version of the textbook view, which he calls “relative differentiation.” Brands may not be unique, he argues, but they can offer “more of something” than their rivals, and although this kind of advantage is rare, brands should build and protect it. In his words: “My bullshit stat has always been [mental availability is] 70 to 80% of the job. I still maintain that there should be a quotient on top of that which is about differentiation."1
Sharp concedes that differentiation might matter in some situations, but says the bigger story is “how shockingly low it is or how little it matters.”2 For Sharp, growth comes from distinctiveness, not from a unique position in the market: recognizable colors, fonts, mascots, jingles, and taglines. Communicated widely enough, these assets build the mental availability that turns into buying.
The question divides marketers between two very different growth strategies, and after years of debate, it still rests on claims like “some situations” and “shockingly low.” It deserves evidence and numbers. So we studied 246 brands across five markets, surveying 60,000 respondents, to find out whether being different from your rivals helps a brand grow.
The short answer: Ritson is right. Differentiation matters, and building mental availability around some needs can be 2.5 times easier than around others. For a challenger brand with limited resources, choosing the wrong proposition could be a costly mistake, one it may never recover from.
The longer answer comes down to three principles we uncovered in the data. They determine whether linking a brand to a particular need, whether a buying occasion, a product function, an emotional benefit, or a symbolic one such as status, can put it on a path to growth. They also show why neither pure distinctiveness nor some classic differentiation advice is a reliable route to growth.
Most brands have clear strengths and weaknesses beyond their size
Big brands get linked to almost every need, simply because more people buy them.
Ask American cola buyers whether Coca-Cola tastes great, and 75% say yes. For Virgil’s Cola, it’s 6%. That isn’t a verdict on flavor. Every cola we measured, from Pepsi and RC Cola to Shasta and Zevia, sits where its size predicts.
But only about a third of the needs we measured are this closely size-driven. For the rest, size still matters, but much less. As we’ll see, these are the needs where challengers have a chance to stand out.
Differentiation can look “shockingly low” because, overall, size explains 90% of all brand associations in our study. But that 90% mostly explains why markets change so little: once you are big, being big helps you stay big. It says little about how brands grew into their current positions. The remaining 10%, the mental availability that size cannot explain, is where a brand can move beyond its current position and grow.
If you take size out, across 246 brands, most brands in every category have clear, distinct strengths and weaknesses. Three in four have both at the same time.
Behavio (2026)
Figure 1
Part one
EVIDENCE
Heading 1
CHAPTER 01
The dog food marketer’s dilemma: which need should a challenger claim?
You have just been hired as CMO of an ambitious challenger brand in the American dog food market. The founder is a dog lover and something of a genius, and the product is better on almost every front: more meat, more natural ingredients, made from American produce, or a low enough price to compete on cost. Your job is to find the route to market that will make the brand grow fast.
You cannot say everything in one ad. You have to choose, and you would rather not rely on gut feeling. So you commission a basic market study and get back a table like this.
What a typical attribute study hands you.
Behavio (2026)
Figure 1 · For US dog food, the share who say each need matters and the share who link the average brand to it, with the gap in points.
What would you choose?
Usually, there is an expert around to interpret the data. The trouble is that the two big schools of marketing interpret the same table in opposite ways.
The traditional differentiation school tells you to find the biggest gap that matters to buyers and that you can serve, build the whole brand around it, and be meaningfully different. Its sophisticated versions squeeze far more out of the data, looking at which needs cluster in which segments, how much those buyers spend, and who you can realistically reach. But underneath sit the same two axes: how much a need matters, and how free it is. Our simple version points first to exactly for my dog, with the widest gap at 42 points, followed by low price at 38. Choose the first, and you play the personality game: develop an insight, an archetype, or a story, then build a creative campaign around it. You become the brand for one kind of dog owner, while someone else becomes the brand for another. Or choose the second, and play the classic low-price game.
Byron Sharp reads the same table differently. Brands compete as near lookalikes, so the blue bars say little about where competitors are weak. They mostly show how typical each need is of the category. The advice, then, is to target all dog owners and focus on being unmistakable through packaging, color, fonts, and memorable advertising. Which association you feature in the ad matters much less. Over time you rotate through the needs that matter most: high meat content on TV this year, feeling like a good owner the next. Once you sit slightly above the norm on all the major needs, you add a less typical one, like food for an aging dog, to stay relevant to more category buyers.
Which reading sets you up for challenger success?
In this paper, we show that neither does.
Both miss the two needs an ambitious challenger should take: natural food and sensitive digestion. Both sit unremarkably in the middle of the table.
Rather than choosing your gap, as the differentiation school would, or your look, as the distinctiveness school would, you should choose your fight.
Why these two needs? To answer that properly, we first need to settle two questions. Do brands really differ in people's minds? And if they do, how do those differences matter for growth? We will come back to dog food in Chapter 3.
CHAPTER 02
Once size is removed, rival brands differ clearly in buyers’ minds
The two readings of the dog food table are not a debate from an old textbook. It is the one marketing is having right now. In June 2026, two of marketing's best-known professors, Mark Ritson and Byron Sharp, shared a stage at Cannes Lions for the most talked-about marketing debate of the year, a session called "Five marketing truths we can actually agree on". They agreed on more than anyone expected. The biggest disagreement was differentiation. Ritson champions "relative differentiation": a brand having "more of something" than its rivals, rather than being unique. He argued that it exists, although it is rare, and that it matters. Sharp said it still might matter in some situations, but the big story is "how shockingly low it is or how little it matters".1
Sharp's answer starts from size: big brands have more users, users say more about a brand, so most of an image table reflects size. "Once the usage effect is removed," he writes in How Brands Grow, "there is little sign of brands having unique images." We measured what is left once size is removed, for 246 brands across 5 markets and 8 categories, to quantify what "shockingly low" could mean.
2.1 Most associations come with size; the rest are owned
Does Coca-Cola taste great? 75% of American cola buyers think so. Only 6% say the same about Virgil's Cola. It's hard not to read that as a verdict on flavor.
It isn't. The scores tell us very little about taste, whether we're talking about Coca-Cola, Virgil's, or any other cola we measured. Each sits on the line where its size puts it (we explain how that line is drawn in Chapter 5). Knowing how many people buy each cola is enough to predict how many will link it to great taste.
Great taste in US colas is granted by size.
Behavio (2026)
Figure 2 · Each dot is a brand. The line shows what a brand of that size is expected to score.
The likely explanation lies in how people answer. When a need feels typical of the category, and a brand feels typical of the category, people answer yes even without a concrete memory link. This happens in surveys, and probably at the shelf, too. We call these associations size-granted: they come with being big.
On this chart, size explains the entire score. Some respondents may genuinely love the taste of Coke, but they sit among the many who would have said yes anyway, so their love does not move the score. No cola owns a real position on taste.
Now, what does it look like when size alone can't explain the score? Let's look at American cars, and whether a brand gives its drivers a sense of status
A sense of status in US cars is not explained by size.
Behavio (2026)
Figure 3 · Bars show how far each brand sits from its line. Cadillac owns 22 points beyond the 38 its size grants.
Cadillac is bought by fewer than half as many car buyers as Chevrolet. Yet 60% link Cadillac to status, against 45% for Chevrolet. On the cola chart the bigger brand always scored higher; here a brand less than half the size scores fifteen points more.
Even so, most of Cadillac's score is still size-granted. Only about a third of it, 22 points, is truly owned: links Cadillac has built for itself. In people, that's roughly 22 million American car buyers more than a brand of its size would typically get.
As the chart shows, owned positions can also be negative. Some people who would otherwise say yes based on the brand's size actively disagree, creating a negative deviation. For Toyota, that deviation is 17 points: roughly 17 million American car buyers who actively believe driving a Toyota does not bring you status.
Byron Sharp is right about one thing: most of what a raw image table captures is size. Of all the variation in the data, [76%] comes from brand size and [14%] from how popular and typical a need is in the category. Both are size-granted. Only [10%] is owned.
So if your brand tracker shows only raw scores, you are mostly looking at your market share with dozens of needs written along the top. That's a costly way to measure market share.
It also likely explains why market shares are so stable. Being big makes people think of you across most of the category's buying triggers, which helps keep you big.
This doesn't mean the 10% isn't worth reading, or that brands compete as lookalikes. If competing means overtaking others rather than staying where you are, the part your current size grants you is not much use. The owned part is what can move before sales do.
So let's look deeper into the owned part
Two ways to answer yes.
Figure 4 · Both answers are a yes, but only the owned one is a memory of the brand.
2.2 Every category, and most brands, hold owned positions
On any given need, a typical brand sits 4.2 points from where its size would put it. Most of that is noise: with a fresh sample of 1,000 people, scores would shift by a point or so, like a bathroom scale that never quite agrees with itself. But the big gaps are far too common to be down to chance:
deviation from the size norm
brands with at least one
share of all measurements
over 5 points
72%
31%
over 10 points
42%
8%
And these gaps rarely come alone. Within a typical brand, its strongest and weakest needs sit 17 points apart. Four brands in five have both a clear strength and a clear weakness: a need people associate with them more than their size would predict, and one they associate with them less. Specifically, they score at least 6 points above their line on one need and at least 6 points below it on another. We call these owned strengths and owned weaknesses.
A point looks small on a slide, but every point is a share of the people who buy the category. A modest owned position is a crowd the size of a city; Cadillac's 22 points on status are about 22 million American car buyers.
Big owned positions, counted in people.
Behavio (2026)
Figure 5 · Five owned positions, converted into the number of category buyers they represent.
Some categories leave more room for brands to stand apart than others. Electronics is at the loud end, with the typical brand sitting 7.4 points off its line. Insurance is at the quiet end, at 4.8 points. This difference is not down to electronics having bigger and smaller brands. How unequal brands are in size has virtually no relationship with how far they stray from their lines (a correlation of −0.05, as close to no link as the data gets).
How much brands differ, category by category.
Category
Typical distance from the line (points)
Share beyond ±10 points
Electronics
7.4
15%
Cars
6.9
13%
Cola drinks
6.0
9%
Streaming
5.5
6%
Packaged coffee
5.0
5%
Supplements
4.9
6%
Insurance
4.8
4%
Dog food
4.8
5%
Behavio (2026)
Figure 6 · Each dot is one measurement, in points above or below what the brand's size predicts.
Here is what this looks like within a single category: American cars, with brand size taken out of the equation. Each cell shows the share of car buyers who link a brand to a need beyond what its size alone would predict. A blank cell means size explains the association entirely.
Cars: what a strongly differentiated category looks like.
Behavio (2026)
Figure 7 · Points above or below what each brand's size predicts, US cars. Blank cells are within ±3 points.
Cadillac owns status, but pays for it on price. Tesla owns technology and green credentials, Toyota owns value, and Ford owns the showroom. Chevrolet, the biggest of the six, owns almost nothing of its own. What people think of it is explained by its size.
Cars are easy to tell apart. People argue about them, and carmakers spend fortunes trying to stand out. Coffee, by contrast, sits on a supermarket shelf and gets bought half asleep. British coffee is one of the flattest categories we measured.
Coffee: even the flattest category still has plenty of owned positions.
Behavio (2026)
Figure 8 · Points above or below what each brand's size predicts, UK coffee. Blank cells are within ±3 points.
The patches are smaller, but each brand still has one: Tesco Finest on price, Douwe Egberts on the supermarket shelf, and the comfort of the cup, and Taylors of Harrogate on feeling special. Grind is the brand nobody can find on a shelf.
This chapter opened with the most concrete claim we could find: once the usage effect is removed, there is little sign of brands having unique images. These two grids show what remains after that effect is removed. Almost every brand has a different image, and the differences are not noise. Across all 246 brands, a brand's shape is typically 2.8 times farther from its nearest rival's shape than from its own when measured in a fresh sample.
2.3 Non-buyers see the same owned positions as buyers
Before claiming that owned positions matter for growth, we need to address one objection. These differences could simply reflect what customers say about brands they already buy. People who drive a Cadillac know what it is like, while those who don't might see all car brands as much the same. If so, owned positions would be a record of past purchases, not a route to new ones.
If image simply followed usage, customers would account for the owned associations. Yet 44% of all the owned links people make between brands and needs come from people who do not buy the brand.
We also measured every owned link twice, once among a brand's buyers and once among everyone else. The two groups share no respondents, yet they draw the same shape: their deviations correlate at 0.91 across 4,758 measurements. All 213 big breakthroughs, those more than 10 points above the line, sit above it in both groups. If anything, non-buyers see the differences more clearly: their typical deviation is 4.1 points, compared with 3.3 among buyers.
Buyers and non-buyers draw the same shape.
Behavio (2026)
Figure 9 · Each brand's distance from its line among its buyers and among everyone else, across 4,758 measurements (r = 0.91).
When two groups of strangers describe the same brand in the same way, that is not what noise looks like.
Some brands make the usage explanation arithmetically impossible. In the Netherlands, 46% of streaming buyers link Viaplay to watching sport, yet only 17% subscribe. Even if every subscriber made the link, that would be 17 points. In fact, 36 of the 46 points come from people who have never paid for the service.
Most of a brand's owned associations exist in the minds of people who do not yet buy it. Building those associations can drive acquisition, not just customer care.
2.4 No single brand metric, including fame, explains owned positions
The car and coffee grids probably made this clear already, but the objection deserves a direct answer. Brands may differ once size is taken out, but could those differences be explained by another single number, such as prompted awareness, spontaneous recall, or how much people like the brand?
No single number can produce the patterns we see in the grids. A single number per brand would lift or lower it across every need at once. It cannot explain why Cadillac sits 22 points above its line on status and 10 points below it on low price. Four out of five brands show a clear strength and a clear weakness at the same time.
In short
• Nine tenths of what people say about brands is size and how typical the need is.
• The last tenth is the brand's own. Three brands in four have a clear strength and a clear weakness, and Cadillac's 22 points on status are about 22 million American car buyers.
• Rivals hold different strengths, and the same shape shows up among people who don't buy the brand.
CHAPTER 03
Challengers grow by fighting where brands already differ
Most brands don't grow. Not in revenue, not in market share, and not by riding a growing category: wherever you look, growth is rare, and market shares stay remarkably stable from year to year.2 When growth does happen, it often comes from outsmarting a specific situation: a hard-to-copy innovation, being early to a new category, finding or creating a channel nobody else can use, or making customers unusually loyal. Each is an achievement against the odds, and worth praising. But most are hard to plan or research. They come from specific knowledge, genius, or luck, or bring only limited success. Harvesting the people already searching for a product is a great start for a startup, but not a strategy for scaling.
This chapter looks at one type of growth: memory-driven growth in the number of buyers. It is the part of the Ehrenberg-Bass findings few people dispute. A brand can make its buyers buy more often, or pay more, but nothing makes it as big as selling to more people. You can see it without any science: the mainstream groups own the premium brands, not the other way round. Toyota owns Lexus, and Volkswagen owns Audi, Bentley, and Lamborghini. Nor does it take proof that mainstream buyers buy the brands that come to mind. People sometimes ask Google or an AI agent for the best option, but that always takes more effort than searching their own memory when it already holds a good-enough answer. So most people don't google the nearest supermarket, don't check every item on the shelf, and pick brands they already know on marketplaces. Some categories are more impulsive, and memory predicts them a little less well, but memory is a key driver wherever you look. So the question for a small consumer brand that wants to grow into a mainstream one is how to come to mind for more people.
This is where the two readings of the dog food table in Chapter 1 come back, and with them the Cannes debate. The differentiation school says: find a gap that matters, own it, and people will think of you whenever they want it. Sharp's distinctiveness school says every brand gets linked to most needs in line with its size, so the way to grow is fame: massive reach, unmistakably branded, with the message itself free to rotate over the years.
The last chapter showed that the traditional, strong version of differentiation does not hold: 90% of what comes to mind is driven by size alone. For most people, Volvo does not come to mind because it is safe. Yes, it sits 14 points above its size on safety, so many people really do choose it for that. But far more often, people think of Volvo as environmentally friendly, or link it to anything else, purely because it is a big, solid car brand in their minds. This is Mark Ritson's position: a brand does not need to be unique, but being better at something can be vital for growth, and worth protecting once it has been won.
Most marketers reach for one of two answers. One is to get famous and distinctive, through reach and assets such as colors, logos, and characters. The other is to find an empty need, a spot no brand owns yet, and be first there.
In our data, neither works on its own. Tesla is known by 83% of American car buyers and bought by 10%. On the car itself, its price and where to buy it, it is about as small in memory as in sales (3.1). And empty needs are mostly dead ground: only eight of 246 brands stand out on a need that is dead in other countries, and none of them is small (3.3).
What works is a fight that has already started. On needs where rival brands already differ from what their size predicts, a mid-sized challenger stands out nearly three times as often as on needs where nobody does. Where more buyers care about a need than brands are linked to it, it stands out about 40% more often. The same needs are where leaders lose ground (3.6).
One wave of data cannot prove that winning these fights causes growth. It shows where challengers already hold strengths, and whether those places can be predicted. Whether winning them brings buyers is what the next waves will test.
Three questions sort the needs.
Is the need a battlefield? On many needs almost nobody has built an owned position. A brand is more likely to hold a strength where its rivals have moved away from what their size gives them. There, perhaps counter-intuitively, leaders more often lose ground and challengers get their chance.
Has the market caught up with demand? On some needs, buyers' heads are already crowded with brands. On others, many buyers care about the need but few brands are linked to it. That gap matters most for mid-sized brands, which hold strengths on free needs half as often again as on taken ones.
Is the need big enough to be worth it? Almost every need is bigger than a small brand, so a small brand can start growing on any of them. For mid-sized and large brands, a need with a low ceiling can limit the growth they can achieve from investing in it.
The three questions matter in a different order for brands of different sizes. To test that order, we took brands that had grown to mid size, large enough to leave a trace in memory, hid each brand from the data, and let the three questions determine where it should compete. The top picks matched its real strengths twice as often as the bottom picks did: 36% versus 17%.
3.1 Fame and distinctiveness alone do not make a brand grow
Fame and standing out are the two things the growth playbook leans on most. Tesla has both, and it shows what they do and do not buy.
Awareness, salience, and liking mostly measure size. Across 246 brands, awareness correlates with penetration at 0.76, spontaneous salience at 0.81, and liking at 0.89. When awareness runs far ahead of size, it does not automatically translate into buyers. Tesla is known by around 80% of car buyers in every market we measured, yet only 2% buy it in Czechia, 8% in Germany, and 10% in both the Netherlands and the United States.
Its fame is real. On promotion, Tesla sits [8 to 11] points above its size in all four markets. But the fame stays there. On product, price, and place, Tesla sits close to where a brand bought by so few people would: on average [−2.6] points in Germany, [−2.2] in Czechia, [+0.8] in the Netherlands and [+3.8] in the United States. Everyone knows Tesla, but few link it to more buying situations than its size gives it. So this is not a brand that most car buyers already think of when they choose, held back by some hidden barrier like Elon Musk. Its memories are about as small as its sales.
That complicates the prescription that growth comes mainly from reach and fame. Awareness still matters: a brand nobody knows cannot be chosen. But awareness alone is not enough. Building size-granted links is circular, since they come with size rather than before it. That leaves one thing a growing brand can build ahead of its size: owned positions.
3.2 Movability: challengers win where rivals already differ
Imagine you are the CMO of a Dutch supplement challenger brand, deciding between two messages for your first TV campaign. Both are mainstream and matter to most buyers, but you can afford to focus on just one. Which would you choose?
On one need size decides; on the other, brands differ.
Behavio (2026)
Figure 10 · Dutch supplements. No brand sits more than 3.4 points from its line on highly effective; three sit 6 or more off on clean and natural ingredients.
On highly effective, every brand sits close to its line. None deviates by more than 3 points. On clean and natural ingredients, the ground is more contested: Holland & Barrett sits 9 points above its line, Vitakruid 8 points above, and the category's biggest brand, Kruidvat's own label, 12 points below.
The left-hand option is tempting. Nobody stands out on it, so the first brand to do so could have the territory to itself. An untouched island.
But perhaps the island is empty for a reason. Brands in this market have had years, and usually much bigger budgets than yours, to stand out on highly effective. None has managed it.
So which story is the likely one: an untouched island waiting to be claimed, or dead ground that does not let anyone differ?
Asking whether brands hold strengths where they differ would be circular: of course they differ where they differ. Perhaps every strength is simply part of a brand's own story, a founder's obsession, or the result of one lucky campaign. If so, nothing in the market itself could point us towards it.
Real estate agents know a simple test. Cover up a house's price: if you can still guess it from the street it stands on, location matters. If you cannot, it is all about the house. We ran the same test on brands. We set each brand aside in turn, so that nothing about it entered the calculation. Using its rivals alone, we measured how far brands in the category deviated from what their size predicts, need by need. We then took two needs for the brand we had set aside: one where it breaks through, sitting at least 6 points above the norm for its size, and one where it does not. Because both needs belong to the same brand, its size, budget, and overall strength cannot explain the difference. In 62 out of 100 such pairs, the need where the rivals spread out more is also the one where the brand breaks through. Chance would produce about 49, and at most 52. We repeated the test for every brand, setting each one aside in turn.
A brand is more likely to hold a strength where its rivals already differ. If quiet needs were islands waiting to be claimed, brands would be just as likely to build strengths there. They are not. Quiet ground is more likely dead than empty.
That is why we call it movability: whether a brand moves on a need is not just its own decision. The ground has a say, too. Dead ground can still move, but rarely does. Highly movable product needs account for just 14% of all brand-need pairs, yet they account for 36% of big product breakthroughs, those more than 10 points above the line. Small brands are four times as likely to hold a strength on movable needs as on dead ones, while mid-sized brands are two and a half times as likely. Winning a fight may be hard, but it is still easier than winning dead ground.
Movability: do brands already differ on this need?
Movability: dead, mid, or movable.
Behavio (2026)
Figure 11 · Dutch supplements. Movability is how far the other brands sit from their lines on a need.
What it asks. Do brands already differ on this need, once their size is taken into account?
How it is measured. Movability is the average distance, in points, between the other brands and the lines predicted for their size. The brand being judged is excluded, and the line is redrawn without it. This ensures its own result cannot make the ground look more active.
The bands. If the other brands sit, on average, less than 3 points from their lines, the need is dead: size decides. From 3 to 6 points, it is mid. Above 6 points, it is movable.
But the data reveals more. On movable ground, brands of every size have more strengths, but also more weaknesses. Overall, leaders are more likely to lose ground, giving challengers a chance to gain it.
Big brands lose movable ground; challengers come out ahead.
Behavio (2026)
Figure 12 · Share of brand-need pairs with an owned strength or weakness (6 points or more), and the net, by brand size and movability.
These different odds suggest two playbooks: one for small and mid-sized brands, and another for big brands. Challengers should prioritize movable needs. For a big brand, movable ground is a bet. On dead ground, its size-granted position is well protected. On movable ground, that protection disappears, and rivals can take whatever it has not built for itself. But the brand can also pull ahead there. Section 3.6 shows which needs are worth the bet.
So for the challenger CMO, clean and natural ingredients is likely the better bet. For Kruidvat, already 12 points below its line on this need, it is a place to tread carefully. That is why, in Section 3.6, large brands start with ceiling, not movability.
At the end of this chapter, one final experiment tests whether the full model, with all three questions, can predict where challengers actually stand. Because the model ranks movability highest for challengers, the experiment also provides another test of movability.
3.3 Basic occasions and typical emotions are mostly dead ground
Across the study, 36% of brand-need pairs sit on dead ground, where the other brands are, on average, less than 3 points from their predicted lines.
The dead list has some patterns. Much of it is the most basic category occasions and functions: morning energy boost in coffee, to refresh myself in cola, clear terms and conditions in insurance. Much of the rest consists of deeper emotional needs that are very typical of the category: feeling like a good owner in dog food, feeling secure in insurance, to feel alive in cola, to feel confident in supplements. Across the study, brands hold strengths on emotional needs in 9.2% of cases, compared with 12.9% expected by chance.
Why are these needs dead? The data cannot tell us for sure, but it seems unlikely to be because no one has tried. Category functions have always featured in communications, and brands have spent decades of advertising trying to own deeper emotional needs.
Perhaps the fight has canceled itself out: brands have pushed the same need for years, and each brand's gains have been matched by its rivals'. Or perhaps the need is so typical of the category that buyers never form a distinct memory linking it to any one brand.
Emotional needs may also be too abstract or broad. There is a hint of this in the data: in the rare cases when an emotional need does move, the brand has moved on several more concrete needs, too. In Britain, Butternut Box stands out on feeling like a good owner, as well as on natural food, high meat content, and sensitive digestion.
So is the empty island always a mirage? Not entirely. Some needs that are dead in most markets do move in one. Orthomol, a pharmacy brand, stands 11 points above its line on highly effective in German supplements, while the same need is mostly dead elsewhere. Allianz does the same with its branch network in German insurance, as does Simon Lévelt with rich flavour in Dutch coffee. Across the study, eight brands moved a need that is dead elsewhere: five large brands, three mid-sized ones, and no small brands. They entered their markets in 1934 on average. The only one to enter its market this century is Amazon. Every other brand moved the need with decades of substance behind its claim.
This is not to say you can never move a dead need. But when a brand does, it is the exception, and there should be real substance behind the claim.
What, then, are the most typical movable needs? They include symbolic needs such as status, design, environmental friendliness, and the country of origin. Unlike the dead emotional needs, these can all signal something to other people. Then there are functional needs, such as installation services, expert advice, kids' profiles, and being gentle on the stomach. And it is not just product needs that move: price, place, and promotion cues are highly movable, too.
Movability alone shows that freely rotating needs in your communications may not be the best way to build genuinely owned positions, especially for small and large brands. The needs easiest to put into communications without backing them up with product substance are the hardest to move. Where brands build truly strong positions, the need typically requires real product substance and sustained focus.
But movability is not the only factor in deciding which needs to pursue.
3.4 Occupancy: free needs offer room that taken needs do not
Now imagine you are a manager at Apple TV, which reaches 23% of streaming buyers in Britain. You need to decide whether to buy sports rights or kids' content rights to attract subscribers. Both needs are movable, and both matter to a similar number of people. But there is another factor: kids' content looks like a more crowded space, with more competition from other brands.
Sport is underoccupied in UK streaming; kids profiles are taken.
Behavio (2026)
Figure 13 · Each dot is a service. The dashed line marks how many buyers say the need matters.
That is what occupancy measures: how strongly the market is already linked to a need, relative to how many buyers care about it. For a service reaching a fifth of all buyers, 29% link it to kids' profiles, compared with 23% who link it to sport, even though more people care about sport. Sport is underoccupied: buyers want more of it than services are known for. Kids' profiles, by contrast, are already taken. Every service in the category falls on the same side.
Free ground is where the market has not caught up with buyers. A brand that moves into it meets existing demand rather than competing with established players. NOW, a service the same size as Apple TV, sits 12 points above its line on sport. Disney+, with 56% of buyers, sits 13 points above its line on kids profiles. Across the study, mid-sized brands like Apple TV hold strengths on free needs 1.5× as often as on taken ones:
Brands with a strength
on free ground
on taken ground
Small
5.9%
4.8%
1.2×
Mid-sized
19.7%
12.9%
1.5×
Large
9.2%
13.2%
0.7×
Share of brand-need pairs where a brand sits 6 points or more above its line. Product needs only.
For small brands, occupancy barely affects how often they hold strengths. But they have fewer weaknesses on free needs: 2.7% versus 4.1% on taken needs. For large brands, the pattern flips. Taken needs are their home ground, where they have more strengths and fewer weaknesses (11.7% versus 17.5%). Free needs are where market leaders are exposed. Disney+, for example, sits 14 points below its line on sport.
Occupancy: do buyers care about this need more than brands are linked to it?
Occupancy: taken, mid, or free.
Behavio (2026)
Figure 14 · German cars, seen from Tesla. The dot is a brand with 20% of buyers; arrows are not to scale.
What it asks. Do buyers care about this need more than brands are currently linked to it?
How it is measured. Each need gets two numbers: how many buyers say it matters, and how strongly the market is already linked to it, measured by the score of a typical brand that reaches one-fifth of all buyers. Usually, the more people care about a need, the more strongly brands are linked to it. Across a brand's product needs, this relationship gives us the expected link for each level of importance. The gap between the expected and actual link is what counts.
The bands. A need below the line is free: brands are linked to it less strongly than its importance would suggest. A need above the line is taken. Each brand's needs are split into thirds, so free, mid, and taken are always relative to that brand's other needs. Tesla has four free needs, three taken needs, and three in between.
There is one more benefit to free needs. In Ehrenberg-Bass terms, what matters is your share of all the links buyers hold in a category. On that logic, free needs make more sense arithmetically, too. Imagine you have chosen to invest in either kids or sport rights, and a successful campaign earns you a 15-point owned position on that need. The same 15 points will not have the same effect on your chances of being chosen, because the pool of links you compete for differs in size. Across all services, links to sport add up to 194, compared with 277 for kids profiles. Apple TV holds 11.3% of all links to sport and 10.8% of links to kids profiles. With 15 more points, those shares would rise to 17.7% and 15.4%, respectively. The same gain buys you about 40% more of the market's memory when the overall pool of links is smaller.
3.5 Ceiling: a need’s reach matters most for large brands
Of the three questions, this is the only one the Ehrenberg-Bass school asks when it sorts needs: how many buyers does each category entry point reach? Ceiling is the same idea: the share of buyers who say a need matters when making a choice.
It matters most for big brands. A leader already sells to most of the category, so it should focus first on the needs that matter to the most buyers, turning to niche needs only after that. MediaMarkt reaches 63% of Dutch electronics buyers. High-quality products matter to 83% of buyers, while installation services matter to 45%. Both needs are highly movable, and MediaMarkt sits on its line on both. If installation became its main story, MediaMarkt would be building its brand around a need that matters to fewer people than already shop there. It would be narrowing its appeal to that of a specialist. The specialists are already there. Expert, which reaches 18% of buyers, sits 24 points above its line on installation, while Coolblue sits 16 points above. For Expert, the same need is two and a half times its size.
Ceiling: how many buyers say this need matters?
Ceiling: niche, mid, or mainstream.
Behavio (2026)
Figure 15 · German cars. Shading marks how many buyers say the need matters: niche below 60%, mainstream above 80%.
What it asks. How many buyers say this need matters when they choose?
How it is measured. The share of category buyers who say it matters, measured by asking them directly. Ceiling measures demand, not difference. Price, place, and promotion items have no ceiling: almost everyone says price matters, while place and promotion items are not needs that buyers can rate.
Ceiling does not change the odds of holding a strength. Brands hold strengths on 12% of the least important third of needs, 13% of the middle third, and 14% of the most important third. What ceiling changes is the prize. Brands that are known to aware non-buyers for important needs convert a greater share of the people who know them into buyers. Across 150 brands, the correlation is r = 0.29, rising to 0.34 for large brands and falling to 0.24 for small and mid-sized brands.
For small brands, ceiling matters least. Even the least important need in the study matters to 24% of buyers, while a small brand reaches fewer than 10%. Every need is therefore bigger than the brand itself. Small brands hold strengths on 5.7% of niche needs, 6.1% of mid needs, and 7.3% of mainstream needs. The differences are minimal.
For large brands, ceiling matters most, and niche needs are where they fall behind. They sit at least 6 points below their line on 22.4% of niche needs, compared with just 6.4% of mainstream needs. That is where the specialists thrive. In Dutch streaming, Viaplay sits 26 points above its line on sport, while Netflix sits 19 points below. A market leader can afford to lose ground on niche needs. It cannot afford to lose ground on the needs that matter to most of its buyers.
3.6 Small, mid-sized, and large brands should ask the three questions in a different order
As we have seen, the three questions do not carry equal weight at every brand size. Together, they create a different order of priorities for each:
first
second
third
Small
Movability
Occupancy
Ceiling
Mid-sized
Movability
Occupancy
Ceiling, needs below 60% out
Large
Ceiling, needs below 60% out
Occupancy, taken first
Movability
Small brands reach fewer than 10% of category buyers, mid-sized brands reach 10–30%, and large brands reach more than 30%.
A small brand starts with movability, because it is the only factor that changes its odds of holding a strength. It holds strengths on 2.1% of dead needs and 9.0% of movable ones. Occupancy comes next, changing the risk rather than the odds. Ceiling comes last, because every need in the study is bigger than a small brand.
A mid-sized brand follows the same order, and here both of the first two steps really pay: it holds strengths on 10.7% of dead needs, compared with 26.6% of movable ones, and on 19.7% of free needs, compared with 12.9% of taken ones. Ceiling comes last, with one adjustment: needs that matter to fewer than 60% of buyers go to the bottom of the list. A mid-sized brand aiming to become a mainstream brand must win buyers it does not reach yet, and niche needs offer too few of them. The 60% cutoff is a judgement, not a finding about the chances of breaking through. Across the study, brands hold strengths on the least important needs about as often as on the most important ones. This is where choosing the right ground makes the biggest difference.
A large brand reverses the order. It starts with ceiling, leaving needs below 60% to the specialists. Niche needs are where leaders fall behind, with weaknesses on 22.4% of them, compared with 6.4% of mainstream needs. And a win on a niche need is worth less to a brand that already sells to most of the category. Among the needs that remain, it prefers taken ones: its home ground, where it holds strengths on 13.2% of taken needs, compared with 9.2% of free needs, and weaknesses on 11.7%, compared with 17.5%. Movability comes last. Across all needs, movable ground is where leaders lose most: large brands hold weaknesses on 33.2% of movable needs, compared with 10.5% of dead ones. But much of that loss comes from niche needs, which the model has already left to specialists. Among the important needs it keeps, movable ground is a real bet, with gains and losses both possible. The biggest brands, those reaching more than 45% of buyers, hold strengths of 6 points or more on about one in five important movable needs, compared with about one in thirty dead ones. They also fall below their line more often on these needs. So among important needs, the model puts movable before dead: a leader that wants to pull further ahead must compete where the market can still shift, and accept that it can lose ground there.
Putting ceiling first for leaders is a judgment: they need prizes big enough to make a difference at their scale. Putting taken before free is backed by the data.
3.7 Hidden-brand and hidden-market tests: the model predicts where challengers hold strengths
You have seen that the order of needs is based on what the data show. But this is far from causal proof that the order affects growth. A single-wave study cannot provide that. We would need a long, detailed timeline, and such studies are rare in marketing science. We nevertheless hope to keep measuring, and in the final chapter, we set out falsifiable hypotheses that could decide it.
There is, however, one strong statistical experiment we can run. If market share has shifted in a category (and brand tracking tells us that, while uncommon, it does happen), that movement should have left some trace in the needs brands own.
For small brands, the signal would be hard to see. They have few breakthroughs, and many still grow through direct channels rather than by building memory. Big brands, by contrast, tend to sit flat on the category's major needs, with smaller, more scattered owned positions.
The sweet spot is mid-sized brands, those that have reached 10–30% penetration, likely through some concentration of owned needs. We designed two experiments to test whether our simple model can predict real success: a hidden-brand test and a hidden-market test.
One by one, we removed each mid-sized brand and all the data associated with it, leaving no trace of the brand in the curves or in the owned positions of the others. We also measured associations using random pairs, avoiding the brand-set effect found in most brand trackers and studies that use batteries of attributes or brands (see 5.3). Then we asked the model where that brand should fight.
The model ranks every need in the category using only data from the other brands, in this order: movability, occupancy, and ceiling. For one hidden Dutch supplement brand, no need combines all three ideal qualities: movable, free, and mainstream. None ranks among the top nine of the 27 possible combinations. Its best-ranked need comes tenth:
clean and natural ingredientsmid-movablemid-freemid-ceiling
and these two at the bottom:
for sports and exercisedeadtakenniche
to improve skin, hair and nailsdeadtakenniche
Then we revealed the challenger hidden from the data: Vitakruid, with 23% of buyers, a family-owned company that grew by 50–70% a year after 2015. It sits 8 points above its line on clean and natural ingredients. Its strongest position, 10 points above its line on immune and health support, is a need the model ranked fourth. Its weakest product position is for sports and exercise, which sits at the bottom of the list.
We repeated this for all 91 mid-sized brands across 40 categories. The model did not get it right every time, nor should it have. But brands were 2.1 times as likely to hold an owned position on a need in the model's top third as on one in its bottom third: 35.7% versus 17.2%.
There was still one way the model might be cheating: we had chosen the order of the three questions using the same data we used to judge it. But we had measured every category in five markets, so this time we hid an entire market. We tested all twelve possible orders on the other four markets, chose the best-performing one, and used it to predict the hidden market. Then we repeated the process for each of the other four markets. For mid-sized brands, the same order won every time: movability, then occupancy, then ceiling. In the hidden market, the model ranked a need where a brand holds a strength above one where it does not 64.5% of the time. A coin toss would get 50%. Even accounting for the selection process, chance produced a result below 57.4% in 95 out of 100 runs.
We cannot yet prove that building on the needs the model identifies will lead to the most effective growth, although much of the evidence points in that direction.
But we have shown, using the strongest test possible with one wave of data, that it matters which relevant associations you build. For challengers at least, the choice is not arbitrary. You should not choose an attribute simply "based on which message provides the best creative execution", and whether a need is "useful for a large number of people" is the least important of the three questions for small and mid-sized brands.
3.8 Dog food revisited: The Farmer’s Dog wins the movable fights
Let's now see what this means for a category and the brands competing in it, returning to the dog food example from the first chapter.
Where does the challenger fight? We have already mentioned The Farmer's Dog. Like Vitakruid, it occupies exactly the ground the model would recommend to a challenger. And the bigger the fight, the more it wins: its two largest owned positions, natural food (+13) and sensitive digestion (+10), are the only two movable needs in the category.
The bigger the fight, the more The Farmer's Dog wins it.
Behavio (2026)
Figure 16 · The Farmer’s Dog (25% of buyers): its owned position on each US dog food product need, against the need's movability.
Here are the competitors. This does not look like classic differentiation, where each product need belongs to a different player. Instead, the category is defined by a couple of product fights, each with a clear winner.
In US dog food, a few product fights each have a clear winner.
Behavio (2026)
Figure 17 · Points above or below what each brand's size predicts. Blank cells are within ±3 points.
It is also not a battle of better or worse promotion. What is striking is how closely the market data match what the company actually does. The Farmer's Dog was founded in New York in 2014. The founders reportedly approached more than 200 factories before finding one willing to make their food. They went on to become the first company to produce dog food in a facility designed for human food.3 They developed their recipes with veterinarians from the start, and manufacture everything in the US.
Which fight should the ad focus on? Even a brand that wins both fights has to choose what its ads say. Imagine The Farmer's Dog decides to advertise during the Super Bowl. The ad needs to be entertaining, but what is the one thing viewers should remember? The model ranks sensitive digestion ahead of natural food. Both are battlegrounds, and both have a mid-level ceiling. But natural food is already crowded, while sensitive digestion is free: more buyers care about it than associate it with any brand. The first brand to claim free ground has an easier path to ownership, and captures a larger share of the memories buyers hold in that space.
Where the model sends The Farmer's Dog.
Behavio (2026)
Figure 18 · Its six top-ranked product needs in US dog food, with each need's three bands.
Of course, the ranking is a starting point, not the brand's priority list. It reflects how one snapshot of the market sees the needs, while anyone using it knows things that snapshot cannot capture. One need's ceiling may be growing fast while another's, despite ranking equally, is shrinking. A brand may be unable to deliver what the market is open to. And one need may be worth far more in revenue or margin than another. For example, in the client dashboard we are building, this knowledge is one click away. A team can rule out a need or move another up the list, add a note, or document the reasoning behind the decision, and the ranking reorders accordingly. But the ranking should start with growth potential: where there is room to win new buyers.
Should the leaders follow? Leaders that can move fast with real substance are copying the challenger. General Mills launched a fresh Blue Buffalo line in 2025 and publicly stated that it expects the US fresh dog food market to grow from roughly $3 billion to $10 billion within a decade.4 When leaders start copying a need, it is also an independent signal that a challenger has grown by owning it.
The model sends most brands in the category into the same two fights, but the prize differs by brand. For Blue Buffalo, sensitive digestion is still its top need, but it ranks 10th among the 27 possible combinations, rather than 2nd. Ideally, a large brand would fight on a mainstream need that is both movable and free. But this category offers no such need: none of the product needs we measured matters to more than 80% of buyers. With 46% of buyers already, Blue Buffalo needs a bigger prize than this category offers.
And Purina? With 65% of buyers, Purina's position is far from comfortable. No product need is big enough to fuel growth for a brand of its size, and in the category's two big fights, it can only lose ground. The data say so, and so does the product reality: shifting mainstream production to human-food-grade standards is not realistic. Purina could launch a fresh food line or acquire a challenger that already has one, but either move would be defensive, aimed at limiting the damage. The model ranks natural food last among its six product needs worth pursuing. Instead, it points Purina first to high meat content and exactly for my dog, where closing the gap is likely to be easier on the production side, too.
Product is not the whole story, though. To some extent (likely not to this extent), Purina can afford to lose on product if it wins elsewhere. And Purina surely wins the big fight it is in: the one over price.
Every brand in US dog food has a different 4P shape.
Behavio (2026)
Figure 19 · Points above or below what each brand's size predicts, on each of the 4Ps.
Purina would likely struggle to move heavily into natural food without sacrificing its position on affordability. That is the price of its position. The same trade-off appears across the dataset in the relationship between price and quality: owned positions on quality and low price are negatively correlated (r = −0.56 across 72 brands in the 11 categories that measure both). Brands that win on price tend to lose on quality, and vice versa. The Farmer's Dog is therefore attacking Purina where it cannot easily fight back.
Why are some brands better or worse at everything? Strategy is only part of success. Brands can also execute different parts of the mix unevenly. As you can see, a brand's owned positions across the 4Ps do not sum to zero. Some brands are simply stronger across almost everything, as The Farmer's Dog is. Others are weaker across the board, as Taste of the Wild is.
What does this tell us? An all-green brand is bigger in buyers' memory than its current sales penetration would suggest.
If we assume mental availability starts most buying journeys, this points to two possibilities. Either a major barrier exists that we cannot see in buyers' memories (or in the part we measure), or the brand has built memory that sales have not yet caught up with. In the latter case, the company is on a growth trajectory.
Similarly, an all-red brand can mean two things. Either something outside memory is driving sales, which is common for small brands. For a while, they can grow through channels that require no prior memory, such as search results or recommendations to people who are actively looking to buy. But this becomes harder as they scale. For mid-sized and large brands, the more likely explanation is that current sales penetration partly reflects past purchases. We mostly measure buyers over the past year, or even the past 10 years in cars, while mental availability reflects the present. That availability will not sustain the brand's current level of sales.
When we look at how long each brand took to reach its current size, the growth-trajectory explanation seems plausible.
From founding to today's penetration in US dog food.
Behavio (2026)
Figure 20 · Each line runs from a brand's founding year to its share of category buyers today.
Taste of the Wild has gained penetration noticeably more slowly than The Farmer's Dog and Blue Buffalo.
We can show similar figures across other industries, but these are still only illustrations. Establishing causality will require many more waves of measurement over time.
We will return to this in the final chapter. But this chapter treated price and place cues as part of mental availability, and that choice needs defending. Shouldn't mental availability be limited to category entry points, leaving price out? And shouldn't physical availability be measured on shelves?
Mental availability includes links across all 4Ps, not just CEPs
Mental availability is the chance that a brand is noticed or comes to mind in buying situations. It depends on memories linking the brand to the cues that arise in each situation. The more cues a brand is linked to, and the fresher those links, the more likely it is to come to mind and be bought.
On the page in How Brands Grow where mental availability is first introduced and defined, Byron Sharp describes it as the network structure in buyers' memories and illustrates it with a bank. The first association on his list is a branch near work, a place association. Three others of the twelve are also about place: a branch on high street, internet banking, and can get cash out. Three are about the product: home loans, Visa, and my first credit card. Another three are distinctive assets, which fall under promotion: the color, the logo, and the staff uniform (p. 177).
However, in How Brands Grow Part 2, in a chapter written by Jenni Romaniuk, the definition of mental availability narrowed. It became tied to category entry points (CEPs): situations and needs that arise before any brand enters the picture, such as saving for a home or moving to a new city. These are what trigger a search in memory. Almost none of the bank associations from the first book would still qualify. A branch near work belongs to one specific bank, so it cannot trigger a search for any bank.
In this view, only CEPs "get a brand into the race". Brand attributes linked to product features or price, described as heuristics, baseline category competencies, or reasons to reject a brand, only help buyers decide "which one to buy when there is a mental availability tie". And if a brand is hard to find, that is a physical availability problem, assessed through store audits, not a question of memory.
In this chapter we show that the original, broader view makes more sense, both in the data and in practice. CEPs are more likely than other attributes to be dead ground, where every brand gets the link simply because of its size. Brands also build strong, readily accessible memories around price and place, just as they do around other needs relevant to a buying situation.
Before challenging category entry points, it is fair to recall what a typical brand attribute battery looked like before they came along. How Brands Grow provides an example: trusted, efficient, rapport, relevant, solution, innovative, essential.
How often have you sent a parcel or bought a phone and thought, even subconsciously, "Ah, essential"? Attribute batteries relied on absurdly brand-centric language, as if buyers had enough spare glucose for their brains to conjure up words like "rapport" while standing at the shelf.
Turning the battery around to focus on buyers and their real needs was absolutely the right correction. To whiten my teeth or to get through the afternoon slump can be genuine needs that lead people to look for a product or brand to meet them.
The second key idea is that a need can simply be an occasion: a Friday night in, a kid's birthday party, when friends drop by unannounced. There need not be a reason to believe or a goal behind it. A brand can be linked to a situation in life, and that alone can matter.
Romaniuk's 7W framework (when, while, with what, with whom, where, why, how) is a useful way to build a long list of situations in which your brand could be the answer.
But Romaniuk goes further, drawing a distinction between CEPs and other attributes. Only CEPs count toward mental availability. Other associations are classified as "baseline category competencies" or reasons to reject a brand. This is where the framework starts to get a little complicated, unclear, and shaky.
4.2 Only the wording separates a CEP from an attribute
For Romaniuk, reliable and good quality are "baseline category competencies", not CEPs, because they cannot exist independently of a brand or product. Nobody needs good quality in the abstract. They need something to be good quality. A buyer does not start the day thinking, "I need a good-quality coffee brand." They start by needing a morning energy boost. No brand is required to define that need: coffee might provide it, but so might exercise. This is where memory retrieval begins. The argument, then, is that only CEPs count toward mental availability.
It sounds plausible, but the distinction between the two mostly comes down to wording.
A simple copywriting change can move an attribute into CEP territory. Reliable does not qualify because reliability needs something, such as an outdoor-wear brand, to belong to. Rephrased as to stay dry when the weather turns, it suddenly fits the Why type of CEPs. That kind of rewording can be useful. But nobody knows exactly how memories are worded or stored in our heads, and they are most likely stored as neither version. Both are highly relevant when buying outdoor gear, far more so than essential. Reliable carries much the same meaning with less effort for the brain to decode. That is hardly a reason to exclude it from mental availability.
If brands are to actively build mental availability, the focus must be on building owned memories, since size-granted links come with size anyway. And CEPs are not the most useful way to sort cues for that purpose.
4.3 CEP-like needs are more often dead ground
Romaniuk recommends that CEPs make up most of a brand tracker's attributes, 60–70%, because they are what make up mental availability. The remaining attributes, baseline category competencies such as reliable or good quality, are there to check that the brand keeps up, "to ensure the brand does not underperform". This is presented as a rule of thumb, without supporting evidence.
The data tell a different story. Many textbook CEPs are dead ground: every brand gets linked to them in proportion to its size, just as it does with a baseline competency. Take coffee, for example.
A morning energy boost is as clear a CEP as any. Yet in Britain and the Netherlands, it is the deadest product need on the list: brands sit just 1.8 and 2.0 points from their expected positions. Every brand gets the link its size predicts, and none gets more. In a tracker, this is exactly the kind of cue that only checks whether a brand is keeping up.
Premium quality, which does not qualify as a CEP under her definition, is the most movable product need in Dutch coffee, with brands sitting 6.7 points from their expected lines. In Germany, the two most movable needs are environmentally friendly (7.4) and gentle on the stomach (6.8), neither of which qualifies as a CEP either. These are the needs where coffee brands differ, yet a tracker following the rule of thumb would only be checking that brands keep up.
Coffee is not an exception. The line between a CEP and an attribute is blurry, so we sorted all 397 product needs using the distinction most often applied in practice. On one side are needs, goals, feelings, and occasions that exist independently of any brand: a pick-me-up, to watch sports events, or for an aging dog. On the other are qualities, ingredients, origins, features, and services: premium quality, German origin, expert advice, or high meat content. The CEP-like needs are dead ground 40% of the time, compared with 28% for the others. Meanwhile, the needs that a CEP list would demote are almost twice as likely to be movable: 18% versus 10%. The pattern holds across all eight categories. In coffee and colas, not a single CEP-like need is movable.
CEP-like needs are more often dead ground.
Behavio (2026)
Figure 21 · Share of product needs that are dead (under 3 points) or movable (6 points or more).
None of this makes occasions useless. Great for evening relaxation in Dutch streaming is a genuine occasion. It matters to 85% of buyers, and it is a competitive battleground: brands sit 6 to 8 points from their expected positions, and five of the six claim it less than its importance would suggest. Netflix sits 9.7 points above its line, Film1, with 6% of buyers, sits 8.3 points above, and Viaplay sits 10.8 points below. An occasion like this belongs on every tracker's long list. But it earns its place the same way premium quality or expert advice does: it matters, and brands compete over it.
And all of this was product. Price and place can be just as movable. In some markets and categories, low price and easy to buy in-store are more movable than almost any product need in the study. Should they count as part of mental availability, too?
4.4 Price and place memories are retrieved as fast as CEPs
Technically, price and place could serve as CEPs: when money is tight, or without having to go far. In the Ehrenberg-Bass model, they never do. In every example, they are classified outside mental availability, as heuristics, competencies, or physical availability. They come into play only after the CEPs have done the retrieval, helping decide "which one to buy when there is a mental availability tie".
Nobody has found evidence of this sequence in the brain. Neither cognitive science nor neuroscience shows that brand memories are retrieved in stages by type:5 first a CEP, then, once a few brands come to mind, price and quality. As far as we know, memories are not sorted by type. They most likely activate in parallel, all at once.
Our own data points the same way. Every response to the 4P cues came within 3 seconds, usually much faster. We discarded the few slower responses. Even so, brands still own strong positions on price and place. These are fast memories, not the result of deliberation.
So this argument does not hold either: "you still need the Mental Availability to be in the race, even when the heuristic helps make the choice." A price or a place memory can be exactly what puts a brand in the race.
Sometimes, of course, a choice does rest on a single, direct, owned link between an occasion and a brand: a learned association that makes me reach for a particular brand whenever a certain situation arises, without needing a benefit or price to tip the balance. But this is not always, or even usually, how it works. As Section 4.3 showed, many occasions are dead cues: every brand is linked to them in proportion to its size, because both the occasion and the brand are typical of the category.
And there is nothing wrong with a brain that relies on the category and a heuristic instead. It is far more flexible and energy-efficient than building a separate link for every possible situation. In a new situation, it is the only way it can work. The first time you find yourself broke, there is no established when I am broke → brand link. You are simply broke, and several things activate at once, including the category and the cue cheap. As a result, cheaper brands come to mind.
5. The brain does work in two steps, just not by type of memory. First, the hippocampus brings back whatever is linked to the situation – so it could be a need, a price, a place, all at once. Then the ventromedial prefrontal cortex puts everything that came back on one scale, and the result is the feeling I want this one. Neither step looks at CEPs first and price later (Shadlen & Shohamy, 2016; Bartra, McGuire & Kable, 2013).
4.5 Price and place in memory differ from actual price and distribution
The usual reply is that place and price are not memories at all. Place is physical availability, price is what appears on the label, and both can be checked through store audits and price lists. True, but none of this argues against price and place memories being crucial to mental availability. A shop opens twenty meters up the street. If nobody knows it is there, your distribution has improved, but your sales have not. A brand can cut its price and still be remembered as expensive.
The gap is the point, not a flaw. Marketers already accept this for promotion. An ad can reach a million screens, yet very few people may notice or remember it. Only those who remember it can buy because of it. The same gap exists across the other three Ps. Audits and channel data are essential for many tactical and operational decisions. But if you have only one number to watch, the Ps in mind are the better choice: a brand is rarely seen as easy to buy unless it is, while it can sit on every shelf and still go unnoticed.
4.6 The 4Ps follow what marketers control, which makes them useful
The marketing 4Ps, product, price, place, and promotion, are the four main levers marketers can pull. They were never defined by what matters to buyers, but by what a manager can control. They divide up the manager's job, not the buyer's mind.
That is also the standard criticism: the 4Ps are too manager-centric, built around what marketers control rather than what people want. This is probably why they never became a framework for sorting attributes in brand measurement, a field that sees itself as the buyer's advocate. Instead, what gets measured has followed each era's view of the customer's mind: functional benefits in the rational era, brand personality in the era that followed, and CEPs today.
We interpret the 4Ps through the lens Bob Lauterborn proposed, as the customer's 4Cs. Seen from the buyer's perspective, they cover nearly everything that shapes a choice, while most batteries cover only part of it:
P
C
what the buyer remembers
Product
consumer needs
it does what I need: an occasion, a function, a feeling
Price
cost
it's worth it
Place
convenience
it's easy to get
Promotion
communication
I know it, I recognize its look and its ads
Promotion is the one people are least willing to admit influences what they buy. Yet there is plenty of evidence that it does: familiarity builds trust and makes the choice feel safer.
Of course, buyers' memories are unlikely to be sorted into these four boxes in the brain. But companies organize their work, and often their teams, around the 4Ps: product, pricing, distribution, and marketing. Most marketing teams no longer control the other three, but they are well placed to show how all four work together in the minds of current and future buyers. It is a perspective the board rarely gets from anyone else.
Measuring the other Ps is also the only way to properly interpret marketing's own results.
4.7 Promotion can only be judged alongside product, price, and place
Most marketers have sat through this meeting. The campaign tested well. Awareness is up, and brand scores are up. Sales are not. Then someone asks what marketing did with the money.
There are two possible explanations, and they call for opposite actions. Either something else is holding the brand back, whether the product, the price, or how easy it is to buy. In that case, more advertising will not fix the problem. Or nothing else is holding it back, and the memory is simply being built before the purchases follow. In that case, the campaign needs more time. On a dashboard that measures only promotion, these two situations look identical.
Measured across all four Ps, these situations look very different. Three challengers in the German car market show how differently a brand can be held back. Tesla sits 9 points above its size on promotion, but price holds it back, worst of all on good value for money. Hyundai faces the opposite problem: it performs far above its size on price but is weakest on promotion, with both its look and its advertising below what its size would suggest. BYD is strong on price, too, but held back by place: servicing, showroom purchases, and test drives. For each brand, the next euro belongs to a different team.
Three challengers, three different brakes.
Behavio (2026)
Figure 22 · German cars. Each brand's 4P shape, and the cues behind its weakest P.
The reverse happens, too: promotion can carry a brand that sits below its size on other Ps, whether by design or not. Coca-Cola in Germany, the Apple Store in the US, and Mercedes in Germany all sit well below their size on price, and well above it on promotion. But each is carried by something different. Coca-Cola is recalled unprompted 13 points more than its size predicts, and its advertising stands out. The Apple Store is carried by its look, its brand elements 11 points above its size, while it is recalled barely more than its size predicts. Mercedes is carried by its advertising, which sits 11 points above its size, while its awareness and recall are no higher than its size predicts. For all three, being below their size on price is part of their position. Mercedes, for example, sits 23 points above its size on status and 22 points below it on low price. We explore the nuances of interpreting these profiles in Part Two.
Carried by promotion, below its size on price.
Behavio (2026)
Figure 23 · Three markets. Each brand's 4P shape, and the cues behind its highest and lowest P.
None of these conclusions is possible from a promotion dashboard alone, or from the usual price and distribution data. Marketers usually respond that they already know their price and distribution. But a store count does not tell you how many buyers find the brand easy to buy, and a price list does not tell you how many consider it good value. Only when all four Ps are measured in the same units and against the same size line can promotion be assessed alongside the other three. Then even a flat quarter after a campaign can be read: the ads had no effect, or they held the line while the product, price, or place got worse.
Even if most marketers control only promotion, measuring the other three Ps using the same cues, protocol, and scale lets them make better decisions about how to use it.
4.8 The 4Ps plus ease of retrieval predict brand size in five markets
A careful reader may have noticed two unfamiliar cues in the last two figures: known and recalled, both measured relative to brand size. Unlike the other cues, which measure prompted links between a need and a brand, these two measure prompted awareness and unprompted recall, each compared with what the brand's size predicts. We added them after investigating whether the 4Ps really explain a brand's sales.
That check is harder than it sounds. Brand size drives around 90% of every brand metric, so everything correlates with sales. Even a dead cue can track sales at 0.99. Liking explains 95% of the differences in sales between brands. Most of that is liking following sales, but what explains the rest? Most likely, something in the concrete 4P cues. Liking rolls all of it into a single number, leaving nobody any wiser about which factors matter. And "be more liked" is not something a brand can act on.
If the Mental 4Ps track sales just as well, that changes the picture. Every detail is captured in the number: the positions a brand owns, how movable they are, and their occupancy. We averaged the cues within each of the four Ps, then averaged the four scores into one. All scores were standardized within each category. Together, the Mental 4Ps explain 92% of the differences in sales between brands, nearly as much as liking.
Could anything improve the result? We tested everything else in the data, including liking. It all moved with the 4Ps and added no new information, with one exception: unprompted recall. Among mid-sized brands, recall behaves differently from the 4Ps. Whether a brand sits at 10% of buyers or 30% can depend on having more 4P links, or simply on being easier to recall. So we added unprompted recall, adjusted for brand size, to the promotion box. Once past buying is accounted for, what remains is ease of retrieval, which promotion can largely influence. Adding it improves the result by three percentage points. More concretely, it brings 11 more brands in every 100 to within 5 points of their actual size.
Together, the 4Ps and ease of retrieval explain 95% of the differences in sales between brands, matching liking. But unlike liking, we know what is inside.
share of sales differences explained
can a brand act on it?
liking
95%
no
4Ps
92%
yes
unprompted recall
87%
partly
4Ps + unprompted recall
95%
yes
And it is not tailored to one country. We worked it out in the United States, then froze it. Next, we used it unchanged to predict brand sizes in Czechia, Germany, the Netherlands, and Britain. It explained between 93% and 96% of the differences in brand size in each market, matching its performance at home.
Frozen in the US, right everywhere else.
Behavio (2026)
Figure 24 · One formula, set in the United States, predicts the share of buyers for 246 brands in five markets.
All of this rests on one step we have so far taken on trust: separating what a brand owns from what its size gives it. The next chapter shows how we account for size, and why most trackers cannot.
[numbers: file (10), share of brand sales explained (R²), z within category – re-run by Vojta on all 40 cells before print]
Heading 1
CHAPTER 05
Why standard trackers miss owned positions, and how we measured them
Roughly 90% of any brand metric is the brand's size. Only the remaining 10% tells you something about the brand itself. This changes how every metric in a tracker should be interpreted, not just attribute scores. In our data, awareness explains 81% of the differences in sales between brands, salience 87%, consideration 93%, and liking 95%. Loyalty, perceived uniqueness, promoter score, and many other well-known metrics follow the same pattern. Taken at face value, they mostly measure buyer numbers in disguise. Until you separate the effect of size, you cannot tell what else these metrics reveal about a brand.
But accounting for size properly is harder than it might seem. We tried to keep it simple, but found that the simple approaches were misleading. What held up was a specific curve for each cue, fitted across all categories and markets at once.
The best-known method, mental advantage, can rank a brand's own memories against each other. But it cannot show which positions the brand truly owns, and it can point the brand in the wrong direction. Mental market share encourages you to interpret gaps as problems, such as poor distribution. Yet much of any gap is noise or reflects which questions were asked.
5.1 Separating owned from size-granted answers depends on a well-drawn size line
An owned memory is a deviation: how far a brand sits above or below what a brand of its size would typically score. So everything depends on getting one thing right: the expected score that brand size alone would predict. Drawing that line is a statistical task. The full method, including the reasoning and equations, is published separately [link]. Here are the principles behind it and how we arrived at them.
Look at these two cues, where no brand clearly owns a position. Every brand sits within 2 or 3 points of its curve, and both curves rise with brand size. But the effect of size is very different for each cue. Great taste in American colas climbs from 6% for the smallest brand to 75% for Coca-Cola. To experience closeness in Dutch dog food tops out at 42%, even for Pedigree, which reaches more than half of all category buyers.
Size grants some cues far more than others.
Behavio (2026)
Figure 25 · Two cues where no brand owns a position: great taste in US colas and to experience closeness in Dutch dog food.
The reason lies in how people answer. Asked whether a cola has great taste, most people say yes for any big brand, even without a specific memory of its taste. Great taste is what colas are supposed to deliver, and big colas are assumed to deliver it. Closeness feels typical of dog food to fewer people, so size accounts for much less of it.
That is what the split from Chapter 2 looks like in practice. About 76% of the differences between scores comes from brand size, 14% from how popular the cue is, and just 10% from the brand itself. That 14% is not a single adjustment for each category. Every cue, in every category and market, has its own curve. A tracker measuring 20 attributes needs 20 separate curves to calculate each brand's deviations correctly.
There is no shortcut. Any method that skips this step will invent strengths and weaknesses, sending brands down paths they cannot win. Mental advantage, the most widely used size adjustment in brand tracking, can misjudge a brand's true position by up to 15 points. The next subchapter explains why.
So what is the best way to draw the curve? Not by deciding its shape in advance. We tested different shapes and kept the one that predicted scores most accurately. The test is simple. Hide one brand's score, draw the curve using all the other data, and ask it to predict the hidden score. The difference between the prediction and the actual score is the error. If you repeat this for every score in the study, the average error shows how well the curve captures what brand size alone would predict. We tested nine shapes. The best missed by 5.1 points on average. Without any size adjustment, the average error was 17.7 points.
The model is hierarchical, meaning each curve can also draw on information from the others when needed. Many trackers have relatively few brands to work with. Our study includes up to 12 brands per category, but usually just six. A curve drawn through six points can swing sharply when one point moves. When the six brands provide little evidence about the curve's shape, the model draws on how the same type of cue behaves across the other 39 category-market combinations. When the six brands show a clear pattern, the curve gives their data more weight. For the smallest brand in each category, this reduced the average prediction error from 5.0 to 3.7 points.
Winning a comparison is not enough, so we ran a few dozen tests designed to find where the method might fail. First, we drew 20 new smaller samples of 1,000 people each. A brand's score varied by about 1.2 points between samples. When a brand scored more than 3 points above or below its curve, the deviation changed sign in only about one case in a thousand. Next, we reduced the questionnaire to 12, 8, and 6 cues. The results matched those from the full questionnaire with correlations of 0.99 or higher. Finally, not a single expected score fell below zero or exceeded 100.
The method is reliable enough for us to confidently treat deviations greater than 3 points as owned memories.
How we draw the size line
The model. A hierarchical (mixed-effects) logistic regression that models each association score as a function of the logarithm of brand penetration, defined as its share of category buyers. The shared component is estimated once using restricted maximum likelihood (REML), based on all 4,758 scores across 40 category-market cells.
The equation. For each cue, the model estimates the odds of a brand being linked to it: logit(score) = μₚ + β · log(buyers ÷ 20) + u(category) + v(cue). μₚ is the baseline level for each of the 4Ps when a brand has 20% of category buyers. This baseline is shared across the study. β = 1.18 describes how quickly scores rise with brand size: doubling a brand's buyers multiplies its odds of being linked to a cue by about 2.3. u(category) allows each category-market cell to start at a higher or lower level and rise faster or slower than the study-wide average. v(cue) allows each cue to differ in the same way within its category.
Why hierarchical. The category and cue effects, u and v, are not estimated independently. Each is pulled toward zero depending on how much its own data, usually from just six brands, can be trusted. Roughly, the weight given to a local estimate is: w = τ² / (τ² + error²). Here, τ² measures how much categories or cues genuinely differ, while error² measures the uncertainty in the local estimate. With few brands or noisy scores, w is low, so the curve relies more on the rest of the study. The slope also depends on how widely the brands vary in size. When their sizes are spread out, the curve can follow their pattern. When their sizes are clustered together, it borrows more heavily from the study-wide slope.
What is estimated where. μₚ, β, and the variances are estimated once for the whole study and are not re-estimated for each new category. For each new measurement, only u and v are estimated, using the data from that category's own brands.
What is left out. The model deliberately excludes a brand-level random effect. This keeps a brand's overall strength in its deviations rather than averaging it away. The question remains: "Does this brand score above what its size would predict?" rather than "Does it score above its own average?"
Awareness and salience are not associations and get their own curve: one slope for each, estimated once across all categories, and a level set within the category.
The deviation is the measured score minus the curve's predicted score, expressed in points. Within ±3 points, the difference is explained by brand size. At +6 points, it becomes an owned strength, and at +10, a major breakthrough. The same thresholds below the curve indicate an owned weakness. The full method, validation tests, and a tool for fitting the curve to your own data are available here: [link]
5.2 Mental advantage judges a brand against itself, not against its size
The most widely used size adjustment in brand measurement is a multiplicative model. In a table, its results look just like ours: +8 here, −4 there. Since Jenni Romaniuk described it in Better Brand Health, mental advantage has become part of brand trackers around the world, including ours originally.
With this model, none of the findings in this book would have been visible. It was designed as a messaging check within the "rotate the mainstream needs" playbook. For that purpose, it can work, with some caveats we'll come to below.
Its defining feature is that all the scores sum to zero. If you add up a brand's advantages and disadvantages, they cancel each other out. This changes the question the model answers. It does not ask, "Mirror, mirror on the wall, who is the fairest of them all?" It asks, "Which is my fairest feature?" That answer can be useful. It shows which features are relatively strongest and weakest for a brand. But your fairest feature might still be plainer than the plainest feature of the fairest brand in the land. Mental advantage will never tell you that.
A brand that is strong across the board sees its ordinary positions as weaknesses. In the Netherlands, Coca-Cola scores exactly where its size would predict on I can afford it regularly, a cue where no brand stands out. Yet mental advantage labels this a 9.6-point disadvantage. Netflix scores 4.7 points above what its size predicts on easy to buy online, but mental advantage calls it a 9-point weakness.
Neither brand has anything to fix here. Both are simply so strong on other cues that a model forced to sum to zero has to push some scores below the line.
The reverse happens, too. A brand that is weak overall mistakes its smallest weakness for a strength. Scrumbles, bought by 17% of British dog-food buyers, scores poorly on almost every cue, so mental advantage expects little from it. On natural food, the need at the heart of the category, it reports a small advantage of +1.8 points. But a brand bought by 17% of category buyers would typically score 28 on this cue, leaving Scrumbles 7 points short of where its size would predict.
The chart shows how mental advantage's expected values jump up and down from brand to brand. That is because each brand's expected score is based on its own answers, not on its size in the market. Mental advantage does not isolate what a brand has built beyond its size. It does not size-adjust a brand. It self-adjusts it.
Same brands, two verdicts.
Behavio (2026)
Figure 26 · Natural food, UK dog food. Left: what mental advantage expects. Right: what a brand of that size usually scores.
Summing to zero has two more costs. First, mental advantage cannot tell you whether a brand is strong overall. In our study, 33 brands score clearly above what their size would predict across their cues. Mental advantage identifies none of them, because every brand's scores must sum to zero.
Second, whatever you gain on one cue, you lose on the others. If a campaign lifts one cue by 10 points, mental advantage shows a gain of about 8 points on that cue. It then subtracts those 8 points from your other cues, taking a little from each, even though buyers' perceptions of you on those cues have not changed.
Across our data, mental advantage points in the wrong direction 260 times. It labels 150 genuine strengths as weaknesses and 110 genuine weaknesses as strengths. That is 11% of all owned positions in our data.
5.3 Random speeded pairs reduce the biases of lists and scales
Most brand trackers use one of two methods. Agreement scales show a brand followed by a list of attributes to rate. Pick-any lists show a cue followed by a list of brands to choose from. We used a third method: random, speeded pairs. Respondents see dozens of pairs, one at a time, with a short cue on the left and a brand logo on the right. They answer yes or no. The pairs appear in random order, and any response taking longer than 3 seconds is discarded. We believe this makes a substantial difference when measuring owned positions precisely, especially for small and mid-sized brands.
Three ways to ask the same question.
Figure 27 · The agreement scale, the pick-any list, and random speeded pairs, as the respondent sees them.
Why go to the trouble? Every list creates a context, and context introduces bias. A brand is judged alongside the names around it, and a cue is judged against the cues that came before it. The answer starts to reflect the screen as much as the memory itself. Many mechanisms can introduce this bias, and they are likely to affect small brands more than large ones. The size curve cannot correct for a bias that does not follow brand size.
What happens
Where
Likely effect
Why
How random speeded pairs handle it
Skimming. People tick the two or three names they know and move on, especially the longer the survey takes
Pick-any lists
Understates small brands
A real link to a small brand ends up as a "no", because nobody got that far
Removed. One brand at a time, so every pair gets its own answer
Place in the list. Brands are often listed un-randomized, or worse, by size,
Pick-any lists and agreement scales
Understates whoever is listed last, usually small brands
Ticks depend on where a brand sits on the screen, not on what people remember
Removed. Pairs come in random order
One answer per need. A list can make some people pick the one brand for each need
Pick-any lists
Overstates the leader, understates the rest on its typical needs
The leader takes the ticks, and brands that are also linked to the need lose them
Removed. No other names on screen to compete with
Forced opinion. A scale asks about every brand, known or not
Agreement scales
Blurs small brands and invents positions
"No memory" and "weak memory" both land in the middle box
Removed. Yes or no, with no middle box; "no" is always a fine answer
Working it out. "Is Brand X…?" with time to think
Agreement scales
Swaps memory for stereotype
People reason "big must have range", "premium must be expensive", instead of recalling
Cut. The cue comes first, and answers slower than 3 seconds are dropped
Halo. A liked brand gets marked up on everything
Agreement scales mostly
Can inflate a brand's overall level, not single cues
Liking follows size at 0.97, so the curve absorbs most of it. What is left lines up with a brand's overall level (0.61), and we cannot tell halo from real strength there
Only reduced. Speed and the cue coming first leave less room for it
Random pairs also solve a problem every tracker owner knows. In scales and lists, answers influence one another. If you change the questionnaire between two waves, the data shift even when nothing has changed in the market. With random pairs, each answer stands alone. You can add or remove a brand or cue without changing anyone else's answers. When we shortened the questionnaire to 12, 8, and 6 cues, the results for the remaining cues matched those from the full version with correlations of 0.99 or higher. This independence also made the experiment in Section 3.7 possible: hiding a brand and asking the model where it should fight. It also allows trackers to maintain a long-term time series even as the brands and cues they measure change.
5.4 The replication kit: results, tools, and questionnaire behind one link
Part One began with you as the new CMO of a dog food challenger, deciding what to say about a better product and facing two playbooks. One told you to target the biggest gap. The other said the choice hardly mattered. Neither tells you which needs an ambitious challenger should pursue. Most of what people remember about a brand comes with its size. But the rest is real, and different for every brand. Some needs offer room to move, while many do not. The needs that do offer room are where challengers win and leaders lose. And what people remember about a brand's price, place, and promotion matters as much as what they remember about its product.
None of this requires our data. It requires a questionnaire that asks about every cue in the same way, and a curve that removes the effect of size from every answer. As we said in the introduction, we welcome replications, amendments, and challenges. So we have put everything you need behind one link, available free after a short sign-up.
The replication kit.
Figure 28 · The results, two generators, and a questionnaire example, behind one link.
The results. Every chart in this book, broken down by category and market.
The 4P cue set generator. Enter a category and market to generate a set of 4P cues.
The questionnaire example. A detailed description of the questionnaire, including random speeded pairs, timing, and randomization.
The size-granted curve generator. The full mathematical method, plus a tool to fit the curves and calculate deviations using your own data.
Part Two returns to the brands themselves. It explores how product, price, place, and promotion each show up in memory, and examines one brand, Kia, that sits above its size on all four.
Part two
Brand stories
Coming in the next release
6Product in memory
7Price in memory
8Place in memory
9Promotion in memory
10Kia: a brand above its size on all four Ps
CHAPTER 11
Limits of the study, and the testable claim behind the model
Our claim is that deviation from the size norm measures something real. Two groups of respondents with no overlap, buyers and non-buyers, show the same pattern. And the largest breakthroughs exceed what a brand's own customers could produce, even if every one of them affirmed the association. The pattern is not simply a reflection of buying.
Does this mean that building the memory drives sales? The model already bets that it does. If brands built on their strengths and strengthened those memories, but penetration never followed, the link between memory and sales would break down. Today, that link holds across 250 brands in four markets [reconcile with 197]. Future waves may prove otherwise. It is unlikely, but possible, and testable.
So far, this is not causal proof that building on a strength makes a brand grow. Cross-sectional data cannot answer that question. The coming waves are designed to get us closer. One thing to test is whether brands like Kia in the UK, whose memory sits well above the size norm on every P, converge upward. Kia's deviations are +6.0 for product, +8.4 for price, +7.6 for place, and +6.8 for promotion. If these memories are real and persist, sales should follow. The most likely explanation for the gap is timing: more buyers would choose Kia today than have had a reason to buy a car this year.
One early indication points in that direction. Among brands whose 4P memories sit significantly above their sales, [XY – share reporting sales growth, from the tracking database] are growing.
A definitive answer will take time, for at least two reasons. First, growth is rare. In the Behavio tracking database, only 8% of brands are growing their sales penetration, and even that figure is probably inflated by the types of companies we work with. Second, people buy infrequently. In categories such as cars, the purchase cycle can last up to ten years. Memory can therefore lead sales by years before any single wave can detect a difference. We will keep measuring. Over time, the waves will provide the answer.
REFERENCE
Glossary
4P cues
Everything a brand can be linked to in memory, across product, price, place, and promotion.
Agreement scale
One brand shown with a list of cues, each rated on a scale.
Big breakthrough
More than 10 points above the size line.
Category entry point (CEP)
A situation or need that arises before any brand enters the picture, such as saving for a home.
Ceiling
The share of category buyers who say a need matters when they choose. Niche below 60%, mainstream above 80%.
Challenger
A small or mid-sized brand trying to take share from incumbents in an established category.
Dead ground
A need where the other brands sit less than 3 points from their lines. Size decides, and brands rarely break through.
Ease of retrieval
How readily a brand comes to mind: prompted awareness (known) and unprompted recall (recalled), each relative to what the brand’s size predicts.
Mental advantage
A common tracker metric that judges each brand’s score on a cue against what the brand’s own scores on all other cues predict, so every brand’s scores sum to zero.
Mental availability
The chance that a brand is noticed or comes to mind in buying situations.
Movability
How far the other brands in a category sit from their size lines on a need, on average, in points.
Movable need
A need where the other brands sit more than 6 points from their lines. The fight has already started. From 3 to 6 points, a need is mid.
Need
A benefit, feature, or situation buyers can link a brand to, such as natural food or a sense of status.
Occupancy
How strongly brands are already linked to a need, compared with how many buyers say it matters. A need is free if brands are linked to it less than its importance suggests, and taken if more.
Owned association
How far a brand sits above or below its size line, in points. Within ±3 points, size explains the difference.
Owned strength and weakness
6 points or more above, or below, the size line.
Penetration
The share of category buyers who bought the brand in a given period. We also call it the brand’s size or its sales.
Pick-any list
One cue shown with the whole list of brands; respondents tick any that fit.
Random speeded pairs
One cue and one brand at a time, in random order, answered yes or no. Answers slower than 3 seconds are dropped.
Size line
What a brand of a given size is expected to score on a cue. Bigger brands are linked to almost everything more often.
Size-granted association
The part of a score the size line explains. It comes with being big, not with a memory of the brand.
Small, mid-sized, and large brands
Bought by fewer than 10%, 10 to 30%, and more than 30% of category buyers.
Free download
Get the full study as a PDF
Every chapter and figure, plus the replication kit, so you can run the method yourself.